


This story originally appeared on Porch.
The U.S. solar industry has grown significantly in the last decade as solar power has become more affordable, efficient and accessible. Since 2014, the cost of solar photovoltaic (PV) panels has dropped by almost 50%.
The U.S. now has over 2 million solar PV installations, which produce enough electricity each year to power more than 12 million homes. According to data from Google’s Project Sunroof, the share of solar-viable buildings that have a solar installation in the U.S. is a mere 1.2%, but many cities boast much larger percentages.
While solar energy has come down greatly in cost, price is still a barrier to many U.S. households who want to invest in rooftop solar. To help offset the installation cost, a federal solar tax credit allows taxpayers to deduct 26% of the cost of installing a solar energy system. Additionally, many states offer solar rebates for home solar energy systems. California even mandates that new construction homes have a solar PV system.
To determine the cities investing the most in solar energy, researchers at Porch, a marketplace for home services, analyzed the latest data on small-scale rooftop solar installations from Google’s Project Sunroof. The researchers ranked cities according to the share of viable buildings with solar.
Researchers also looked at the total number of buildings with solar, the share of all buildings that are solar-viable, the total buildings that are solar-viable and the median annual solar potential per viable roof. For context, the average annual electricity consumption for an American home is 10,972 kilowatt-hours per year.
Here are the large cities (populations more than 350,000) investing the most in solar.
15. Long Beach, California
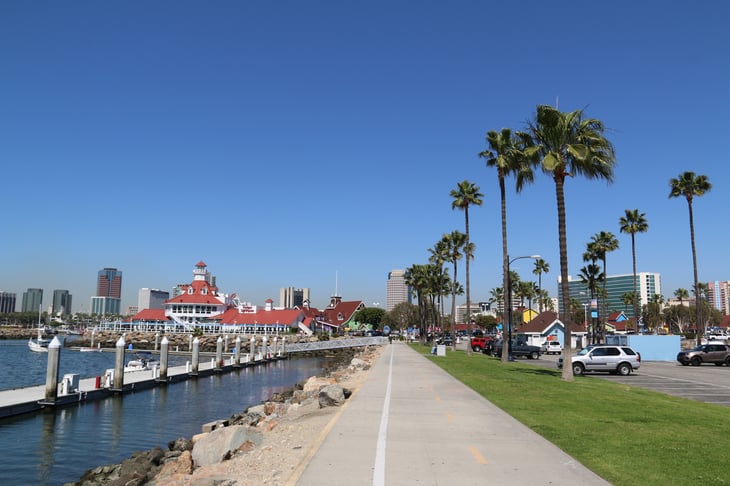
- Share of viable buildings with solar: 1.6%
- Total buildings with solar: 1,469
- Share of all buildings that are solar-viable: 84.3%
- Total buildings that are solar-viable: 91,992
- Median annual solar potential per viable roof: 10,353 kilowatt-hours
14. Sacramento, California

- Share of viable buildings with solar: 2.2%
- Total buildings with solar: 2,860
- Share of all buildings that are solar-viable: 89.4%
- Total buildings that are solar-viable: 131,992
- Median annual solar potential per viable roof: 15,653 kilowatt-hours
13. Phoenix

- Share of viable buildings with solar: 2.4%
- Total buildings with solar: 10,487
- Share of all buildings that are solar-viable: 96.3%
- Total buildings that are solar-viable: 429,903
- Median annual solar potential per viable roof: 22,721 kilowatt-hours
12. Aurora, Colorado

- Share of viable buildings with solar: 2.5%
- Total buildings with solar: 1,956
- Share of all buildings that are solar-viable: 88.8%
- Total buildings that are solar-viable: 77,120
- Median annual solar potential per viable roof: 11,859 kilowatt-hours
11. Las Vegas
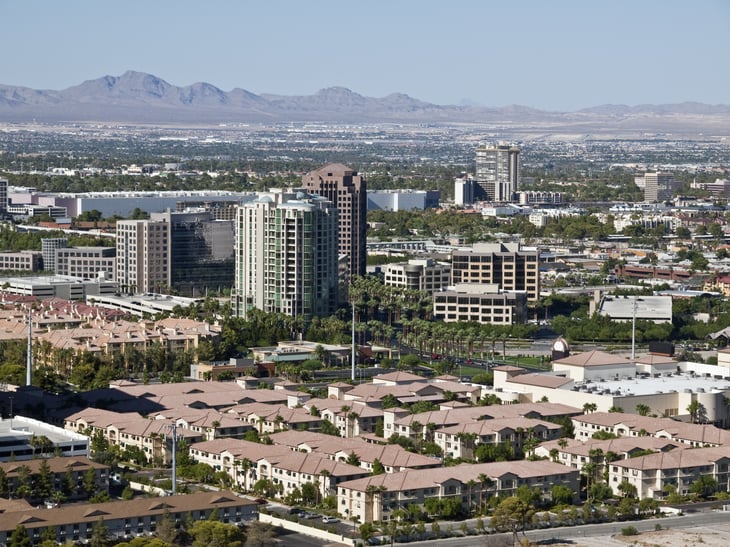
- Share of viable buildings with solar: 2.5%
- Total buildings with solar: 3,093
- Share of all buildings that are solar-viable: 96.5%
- Total buildings that are solar-viable: 124,293
- Median annual solar potential per viable roof: 18,552 kilowatt-hours

10. Los Angeles

- Share of viable buildings with solar: 2.7%
- Total buildings with solar: 17,231
- Share of all buildings that are solar-viable: 82.0%
- Total buildings that are solar-viable: 647,621
- Median annual solar potential per viable roof: 12,356 kilowatt-hours
9. Denver

- Share of viable buildings with solar: 2.8%
- Total buildings with solar: 3,582
- Share of all buildings that are solar-viable: 72.1%
- Total buildings that are solar-viable: 129,386
- Median annual solar potential per viable roof: 9,023 kilowatt-hours
8. Tucson, Arizona

- Share of viable buildings with solar: 2.8%
- Total buildings with solar: 4,437
- Share of all buildings that are solar-viable: 94.7%
- Total buildings that are solar-viable: 155,813
- Median annual solar potential per viable roof: 22,212 kilowatt-hours
7. Oakland, California

- Share of viable buildings with solar: 2.9%
- Total buildings with solar: 2,617
- Share of all buildings that are solar-viable: 90.2%
- Total buildings that are solar-viable: 89,195
- Median annual solar potential per viable roof: 12,450 kilowatt-hours
6. Anaheim, California

- Share of viable buildings with solar: 3.3%
- Total buildings with solar: 2,133
- Share of all buildings that are solar-viable: 96.5%
- Total buildings that are solar-viable: 64,663
- Median annual solar potential per viable roof: 23,004 kilowatt-hours
5. New Orleans

- Share of viable buildings with solar: 3.4%
- Total buildings with solar: 4,322
- Share of all buildings that are solar-viable: 94.3%
- Total buildings that are solar-viable: 126,208
- Median annual solar potential per viable roof: 17,876 kilowatt-hours
4. Bakersfield, California

- Share of viable buildings with solar: 4.5%
- Total buildings with solar: 4,607
- Share of all buildings that are solar-viable: 97.4%
- Total buildings that are solar-viable: 101,638
- Median annual solar potential per viable roof: 24,811 kilowatt-hours
3. Fresno, California

- Share of viable buildings with solar: 5.1%
- Total buildings with solar: 6,945
- Share of all buildings that are solar-viable: 95.6%
- Total buildings that are solar-viable: 135,515
- Median annual solar potential per viable roof: 21,795 kilowatt-hours
2. San Diego

- Share of viable buildings with solar: 5.8%
- Total buildings with solar: 17,281
- Share of all buildings that are solar-viable: 94.5%
- Total buildings that are solar-viable: 300,390
- Median annual solar potential per viable roof: 19,511 kilowatt-hours
1. San Jose, California

- Share of viable buildings with solar: 6.4%
- Total buildings with solar: 13,557
- Share of all buildings that are solar-viable: 96.6%
- Total buildings that are solar-viable: 210,786
- Median annual solar potential per viable roof: 21,543 kilowatt-hours
Add a Comment
Our Policy: We welcome relevant and respectful comments in order to foster healthy and informative discussions. All other comments may be removed. Comments with links are automatically held for moderation.