


Editor's Note: This story originally appeared on Stessa.
The state of the U.S. housing market has been one of the dominant economic stories since the start of the COVID-19 pandemic. The market saw unprecedented price growth over the last two years, and rapidly rising housing costs have been one of the major contributing factors in the historic run of inflation experienced in the U.S. economy over the last year.
Now, with interest rates rising and low- and middle-income households increasingly priced out of the market, a slowdown in the housing market could portend a recession later this year or in 2023.
Record low interest rates, strong savings rates and wage growth, and shifting consumer preferences for housing were among the conditions that spurred high demand for residential real estate over the last two years. But the increase in demand only exacerbated larger challenges with housing supply that predated the pandemic.
According to a 2021 report from federal mortgage backer Freddie Mac, the U.S. is short nearly 4 million housing units based on the country’s population and housing needs.
Despite recent encouraging signs in housing investment, much of the country must catch up to meet the overall need for housing. From 2010 to 2020, 20 states added population at a faster rate than they added housing, a fact that was true even among most of the states that added housing the fastest.
At the metro level, a number of fast-growing cities are rapidly adding housing stock to meet growing demand.
Researchers at Stessa analyzed data from the U.S. Census Bureau’s American Community Survey (2020). Here are the U.S. metropolitan areas that have seen the largest growth in housing over the last decade.
15. Phoenix-Mesa-Chandler, AZ
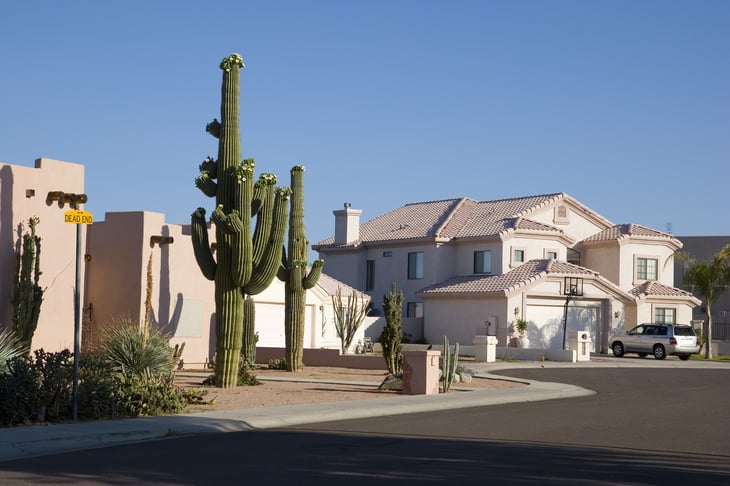
- Percentage change in housing units (2010-2020): +11.4%
- Total change in housing units (2010-2020): +198,147
- Total housing units (2020): 1,943,813
- Total housing units (2010): 1,745,666
- Percentage change in population (2010-2020): +19.1%
- Percentage of housing units that are owner-occupied (2020): 64.4%
14. San Antonio-New Braunfels, TX

- Percentage change in housing units (2010-2020): +11.5%
- Total change in housing units (2010-2020): +93,324
- Total housing units (2020): 903,779
- Total housing units (2010): 810,455
- Percentage change in population (2010-2020):+22.0%
- Percentage of housing units that are owner-occupied (2020): 62.8%
13. New Orleans-Metairie, LA

- Percentage change in housing units (2010-2020): +11.6%
- Total change in housing units (2010-2020): +58,112
- Total housing units (2020): 559,877
- Total housing units (2010): 501,765
- Percentage change in population (2010-2020): +15.1%
- Percentage of housing units that are owner-occupied (2020): 63.7%
12. Jacksonville, FL
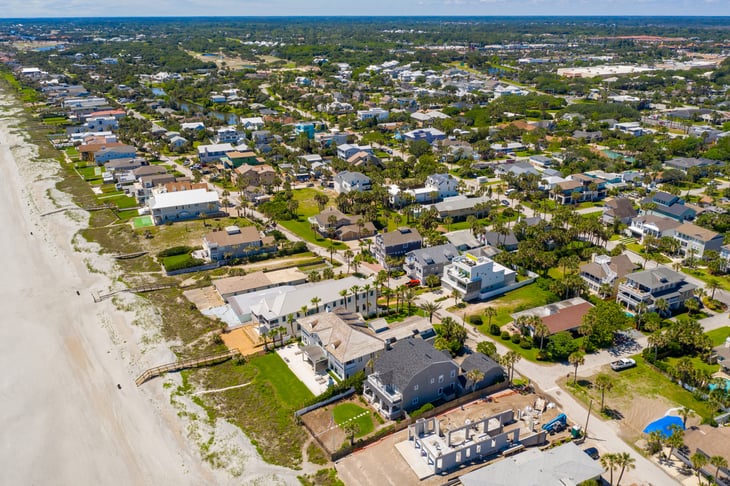
- Percentage change in housing units (2010-2020): +11.8%
- Total change in housing units (2010-2020): +69,065
- Total housing units (2020): 656,551
- Total housing units (2010): 587,486
- Percentage change in population (2010-2020): +16.3%
- Percentage of housing units that are owner-occupied (2020): 65.3%
11. Las Vegas-Henderson-Paradise, NV
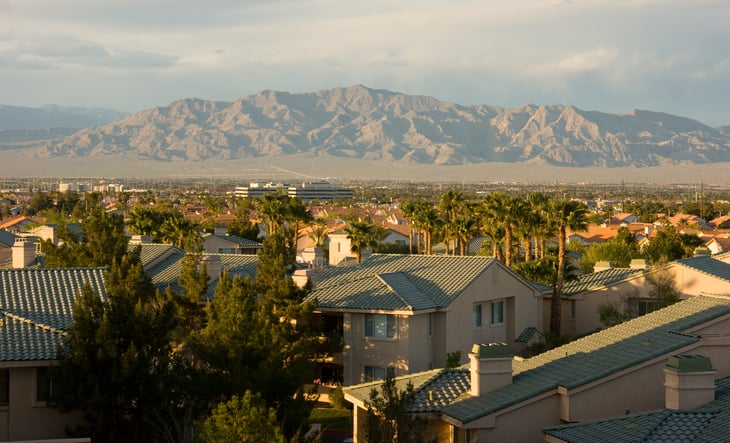
- Percentage change in housing units (2010-2020): +12.3%
- Total change in housing units (2010-2020): +99,625
- Total housing units (2020): 912,465
- Total housing units (2010): 812,840
- Percentage change in population (2010-2020): +17.6%
- Percentage of housing units that are owner-occupied (2020): 54.8%
10. Seattle-Tacoma-Bellevue, WA

- Percentage change in housing units (2010-2020): +12.6%
- Total change in housing units (2010-2020): +180,631
- Total housing units (2020): 1,617,780
- Total housing units (2010): 1,437,149
- Percentage change in population (2010-2020): +17.1%
- Percentage of housing units that are owner-occupied (2020): 60.2%
9. Orlando-Kissimmee-Sanford, FL
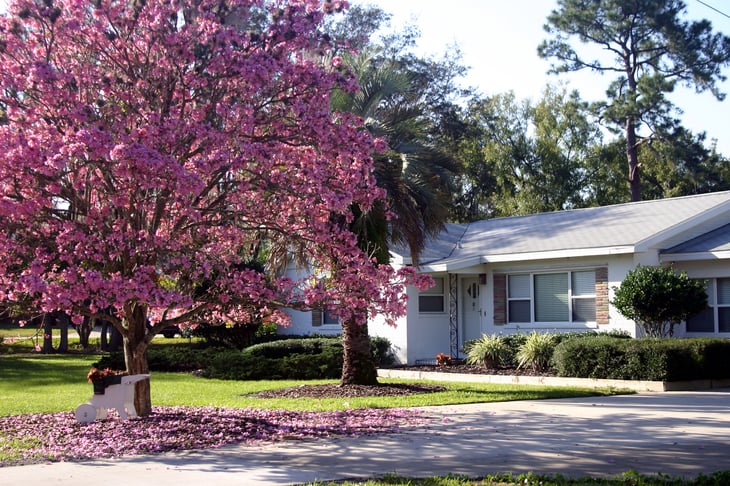
- Percentage change in housing units (2010-2020): +14.9%
- Total change in housing units (2010-2020): +136,735
- Total housing units (2020): 1,054,209
- Total housing units (2010): 917,474
- Percentage change in population (2010-2020): +22.9%
- Percentage of housing units that are owner-occupied (2020): 61.9%
8. Dallas-Fort Worth-Arlington, TX

- Percentage change in housing units (2010-2020): +15.9%
- Total change in housing units (2010-2020): +386,035
- Total housing units (2020): 2,821,032
- Total housing units (2010): 2,434,997
- Percentage change in population (2010-2020): +21.1%
- Percentage of housing units that are owner-occupied (2020): 59.7%

7. Indianapolis-Carmel-Anderson, IN
- Percentage change in housing units (2010-2020): +16.0%
- Total change in housing units (2010-2020): +119,871
- Total housing units (2020): 868,045
- Total housing units (2010): 748,174
- Percentage change in population (2010-2020): +19.4%
- Percentage of housing units that are owner-occupied (2020): 65.7%
6. Houston-The Woodlands-Sugar Land, TX
- Percentage change in housing units (2010-2020): +18.7%
- Total change in housing units (2010-2020): +417,514
- Total housing units (2020): 2,646,682
- Total housing units (2010): 2,229,168
- Percentage change in population (2010-2020): +22.2%
- Percentage of housing units that are owner-occupied (2020): 60.9%
5. Nashville-Davidson–Murfreesboro–Franklin, TN
- Percentage change in housing units (2010-2020): +20.8%
- Total change in housing units (2010-2020): +135,944
- Total housing units (2020): 788,546
- Total housing units (2010): 652,602
- Percentage change in population (2010-2020): +23.5%
- Percentage of housing units that are owner-occupied (2020): 65.6%
4. Raleigh-Cary, NC
- Percentage change in housing units (2010-2020): +22.8%
- Total change in housing units (2010-2020): +101,934
- Total housing units (2020): 548,432
- Total housing units (2010): 446,498
- Percentage change in population (2010-2020): +27.4%
- Percentage of housing units that are owner-occupied (2020): 65.8%
3. Austin-Round Rock-Georgetown, TX

- Percentage change in housing units (2010-2020): +26.7%
- Total change in housing units (2010-2020): +180,417
- Total housing units (2020): 856,586
- Total housing units (2010): 676,169
- Percentage change in population (2010-2020): +33.6%
- Percentage of housing units that are owner-occupied (2020): 58.6%
2. Grand Rapids-Kentwood, MI
- Percentage change in housing units (2010-2020): +30.8%
- Total change in housing units (2010-2020): +99,183
- Total housing units (2020): 421,432
- Total housing units (2010): 322,249
- Percentage change in population (2010-2020): +38.5%
- Percentage of housing units that are owner-occupied (2020): 73.4%
1. Charlotte-Concord-Gastonia, NC-SC
- Percentage change in housing units (2010-2020): +48.7%
- Total change in housing units (2010-2020): +347,800
- Total housing units (2020): 1,062,398
- Total housing units (2010): 714,598
- Percentage change in population (2010-2020): +53.8%
- Percentage of housing units that are owner-occupied (2020): 66.0%
Methodology

The data used in this analysis is from the U.S. Census Bureau’s American Community Survey (2020). To determine the locations that have seen the largest growth in housing over the last decade, researchers at Stessa calculated the percentage change in housing units from 2010 to 2020. In the event of a tie, the location with the greater total change in housing units was ranked higher. To improve relevance, only metropolitan areas with at least 100,000 residents were included. Additionally, metros were grouped into cohorts based on population size: small (100,000 to 349,999), midsize (350,000 to 999,999), and large (1,000,000 or more).
*Stessa is a financial technology company, not a bank. Banking services are provided by Blue Ridge Bank, N.A., member FDIC.
Add a Comment
Our Policy: We welcome relevant and respectful comments in order to foster healthy and informative discussions. All other comments may be removed. Comments with links are automatically held for moderation.