


Editor's Note: This story originally appeared on Porch.
Even two years into the COVID-19 pandemic, Americans are finding that buying a home remains challenging.
A growing work-from-home economy, fueled by households with newfound financial liquidity, has boosted the nation’s demand for homes. Meanwhile, a housing construction industry weakened by the COVID-19 pandemic has allowed the national housing stock to dwindle.
Existing houses are selling faster and at record prices, with some states and metro areas being hit harder than others.
To determine the locations where homes are selling for the most above asking, researchers at Porch calculated the average sale-to-list percentage for 2021. The data used in this analysis is from Redfin. You can read more about our methodology at the end.
Here are the metropolitan areas where homes are selling for the greatest amount over asking price.
15. Los Angeles-Long Beach-Anaheim, CA

- Average sale-to-list percentage: 102.4%
- Percentage of homes that sold above asking: 59.7%
- Percentage of homes pending in less than 2 weeks: 32.7%
- Median sale price: $830,269
- YoY change in median sale price: +15.7%
14. Salt Lake City, UT

- Average sale-to-list percentage: 102.4%
- Percentage of homes that sold above asking: 60.2%
- Percentage of homes pending in less than 2 weeks: 61.5%
- Median sale price: $460,034
- YoY change in median sale price: +22.8%

13. Richmond, VA

- Average sale-to-list percentage: 102.5%
- Percentage of homes that sold above asking: 59.1%
- Percentage of homes pending in less than 2 weeks: 66.4%
- Median sale price: $313,341
- YoY change in median sale price: +11.4%
12. Portland-Vancouver-Hillsboro, OR-WA

- Average sale-to-list percentage: 102.7%
- Percentage of homes that sold above asking: 58.5%
- Percentage of homes pending in less than 2 weeks: 70.0%
- Median sale price: $501,221
- YoY change in median sale price: +15.2%
11. Sacramento-Roseville-Folsom, CA

- Average sale-to-list percentage: 102.8%
- Percentage of homes that sold above asking: 66.1%
- Percentage of homes pending in less than 2 weeks: 66.9%
- Median sale price: $537,479
- YoY change in median sale price: +18.7%
10. Boston-Cambridge-Newton, MA-NH

- Average sale-to-list percentage: 103.0%
- Percentage of homes that sold above asking: 60.9%
- Percentage of homes pending in less than 2 weeks: 38.5%
- Median sale price: $587,553
- YoY change in median sale price: +12.6%
9. Denver-Aurora-Lakewood, CO

- Average sale-to-list percentage: 103.0%
- Percentage of homes that sold above asking: 62.2%
- Percentage of homes pending in less than 2 weeks: 75.9%
- Median sale price: $523,670
- YoY change in median sale price: +16.9%
8. Grand Rapids-Kentwood, MI

- Average sale-to-list percentage: 103.2%
- Percentage of homes that sold above asking: 57.3%
- Percentage of homes pending in less than 2 weeks: 75.0%
- Median sale price: $263,861
- YoY change in median sale price: +15.0%
7. Raleigh-Cary, NC

- Average sale-to-list percentage: 103.2%
- Percentage of homes that sold above asking: 59.0%
- Percentage of homes pending in less than 2 weeks: 40.2%
- Median sale price: $366,666
- YoY change in median sale price: +18.2%
6. Seattle-Tacoma-Bellevue, WA
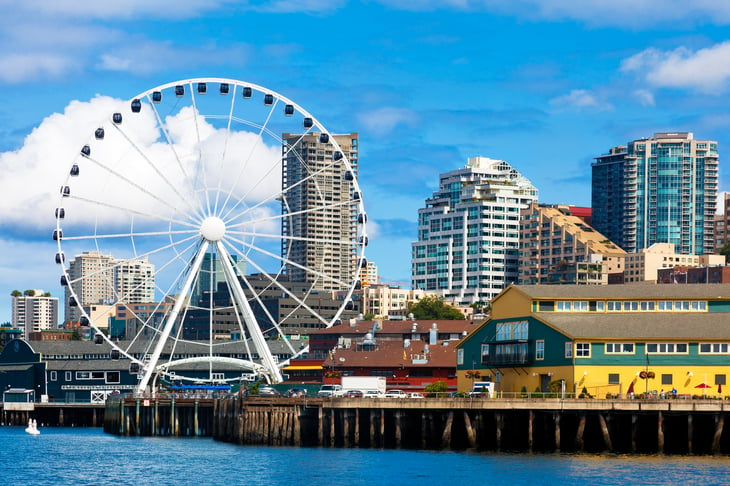
- Average sale-to-list percentage: 104.9%
- Percentage of homes that sold above asking: 61.3%
- Percentage of homes pending in less than 2 weeks: 78.8%
- Median sale price: $662,238
- YoY change in median sale price: +17.7%
5. Austin-Round Rock-Georgetown, TX

- Average sale-to-list percentage: 105.1%
- Percentage of homes that sold above asking: 60.2%
- Percentage of homes pending in less than 2 weeks: 39.8%
- Median sale price: $458,176
- YoY change in median sale price: +32.1%
4. Buffalo-Cheektowaga, NY
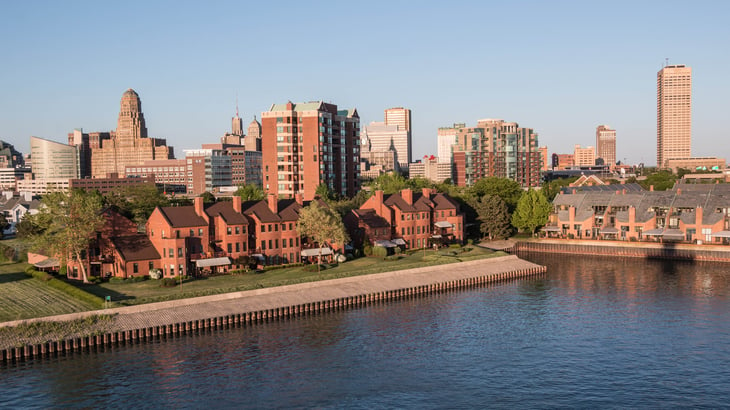
- Average sale-to-list percentage: 105.8%
- Percentage of homes that sold above asking: 64.1%
- Percentage of homes pending in less than 2 weeks: 66.3%
- Median sale price: $203,984
- YoY change in median sale price: +16.5%
3. Rochester, NY

- Average sale-to-list percentage: 106.7%
- Percentage of homes that sold above asking: 66.9%
- Percentage of homes pending in less than 2 weeks: 71.1%
- Median sale price: $185,509
- YoY change in median sale price: +12.2%
2. San Jose-Sunnyvale-Santa Clara, CA
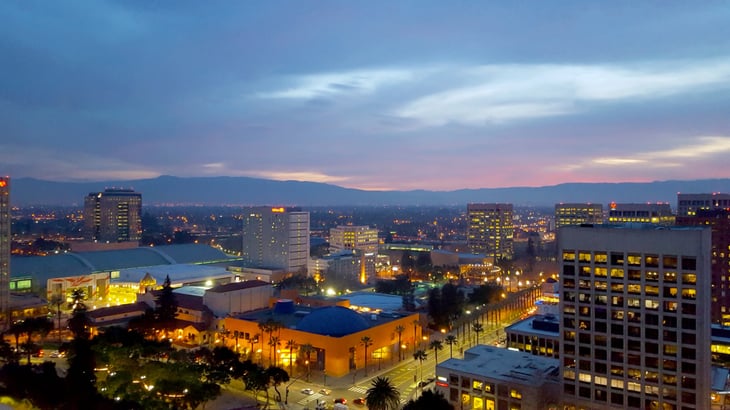
- Average sale-to-list percentage: 106.8%
- Percentage of homes that sold above asking: 75.7%
- Percentage of homes pending in less than 2 weeks: 61.2%
- Median sale price: $1,344,928
- YoY change in median sale price: +13.3%
1. San Francisco-Oakland-Berkeley, CA

- Average sale-to-list percentage: 107.9%
- Percentage of homes that sold above asking: 74.2%
- Percentage of homes pending in less than 2 weeks: 63.9%
- Median sale price: $1,125,602
- YoY change in median sale price: +12.3%
Methodology

The data used in this analysis is from Redfin. To determine the locations where homes are selling most above asking price, researchers calculated the average sale-to-list percentage for 2021. In the event of a tie, the location with the higher percentage of homes that sold above asking was ranked higher.
All the fields were determined using a weighted average of the monthly data based on the number of homes sold for the specific location and time period. To improve relevance, only locations with at least 100,000 residents and complete data from Redfin were included.
Add a Comment
Our Policy: We welcome relevant and respectful comments in order to foster healthy and informative discussions. All other comments may be removed. Comments with links are automatically held for moderation.