


Editor's Note: This story originally appeared on Inspection Support Network.
Much of the housing market made a forced pit stop during the COVID-19 lockdowns of March 2020, but by that summer it was on track and running red hot. The upswing ran contrary to conventional wisdom, and the pandemic-related lull in home sales that some experts expected never materialized.
The opposite happened; both mortgage applications and home sales in the U.S. increased in 2020, exceeding those of the pre-pandemic year prior by considerable margins in many locales.
Data from the National Association of Realtors shows that while the pandemic put a dent in the first-quarter homes sales of 2020, the rebound was enough to top 2019 numbers; existing-home sales in 2020 were up 5.6% over 2019.
Data from the U.S. Census Bureau shows a similar trend for new home sales, which dropped sharply in March and April 2020 before rising sharply at the end of 2020 and then recovering to more normal levels in 2021. This atypical jump in home sales — noteworthy at any time, much less during a pandemic — was driven in part by historically low interest rates and the fact that all signs said these rates would go up in the near future.
To determine the locations with the biggest increase in mortgage loans since COVID-19 began spreading, researchers at the Inspection Support Network calculated the percentage change in mortgage applications from 2019 to 2020. The data used in this analysis is from the Federal Financial Institutions Examination Council’s Home Mortgage Disclosure Act. Only conventional, home purchase loans were considered.
Here are the U.S. metropolitan areas with the biggest increases in mortgage loans since COVID-19 began spreading.
15. Jacksonville, FL

- Percentage change in mortgage applications (2019-2020): +10.9%
- Total change in mortgage applications (2019-2020): +2,151
- Total mortgage applications (2020): 21,943
- Total mortgage applications (2019): 19,792
- Mortgage loan approval rate (2020): 85.6%
- Mortgage loan approval rate (2019): 86.0%
14. Portland-Vancouver-Hillsboro, OR-WA

- Percentage change in mortgage applications (2019-2020): +11.1%
- Total change in mortgage applications (2019-2020): +3,514
- Total mortgage applications (2020): 35,257
- Total mortgage applications (2019): 31,743
- Mortgage loan approval rate (2020): 92.2%
- Mortgage loan approval rate (2019): 92.7%
13. Dallas-Fort Worth-Arlington, TX

- Percentage change in mortgage applications (2019-2020): +11.1%
- Total change in mortgage applications (2019-2020): +9,214
- Total mortgage applications (2020): 92,310
- Total mortgage applications (2019): 83,096
- Mortgage loan approval rate (2020): 88.4%
- Mortgage loan approval rate (2019): 89.0%

12. Nashville-Davidson–Murfreesboro–Franklin, TN

- Percentage change in mortgage applications (2019-2020): +11.2%
- Total change in mortgage applications (2019-2020): +3,274
- Total mortgage applications (2020): 32,464
- Total mortgage applications (2019): 29,190
- Mortgage loan approval rate (2020): 91.2%
- Mortgage loan approval rate (2019): 91.9%
11. Louisville/Jefferson County, KY-IN

- Percentage change in mortgage applications (2019-2020): +11.3%
- Total change in mortgage applications (2019-2020): +1,694
- Total mortgage applications (2020): 16,746
- Total mortgage applications (2019): 15,052
- Mortgage loan approval rate (2020): 89.5%
- Mortgage loan approval rate (2019): 89.8%
10. San Antonio-New Braunfels, TX

- Percentage change in mortgage applications (2019-2020): +11.3%
- Total change in mortgage applications (2019-2020): +2,321
- Total mortgage applications (2020): 22,883
- Total mortgage applications (2019): 20,562
- Mortgage loan approval rate (2020): 81.4%
- Mortgage loan approval rate (2019): 82.6%
9. Birmingham-Hoover, AL

- Percentage change in mortgage applications (2019-2020): +12.4%
- Total change in mortgage applications (2019-2020): +1,496
- Total mortgage applications (2020): 13,515
- Total mortgage applications (2019): 12,019
- Mortgage loan approval rate (2020): 86.8%
- Mortgage loan approval rate (2019): 88.8%
8. Kansas City, MO-KS
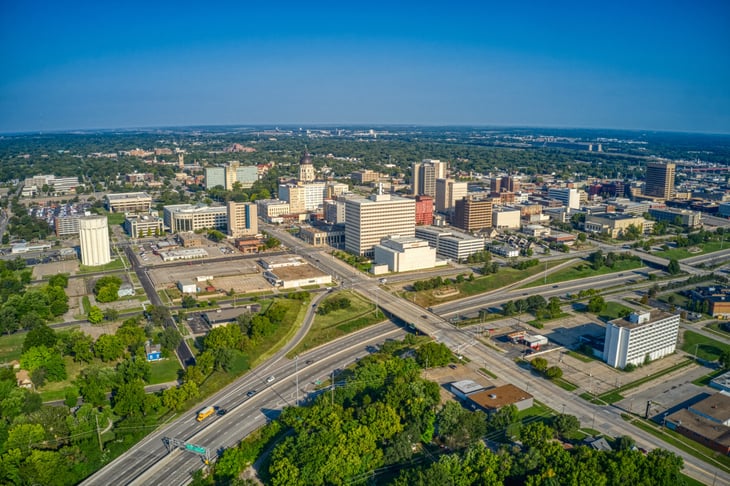
- Percentage change in mortgage applications (2019-2020): +12.5%
- Total change in mortgage applications (2019-2020): +3,344
- Total mortgage applications (2020): 30,131
- Total mortgage applications (2019): 26,787
- Mortgage loan approval rate (2020): 93.4%
- Mortgage loan approval rate (2019): 93.3%
7. Riverside-San Bernardino-Ontario, CA
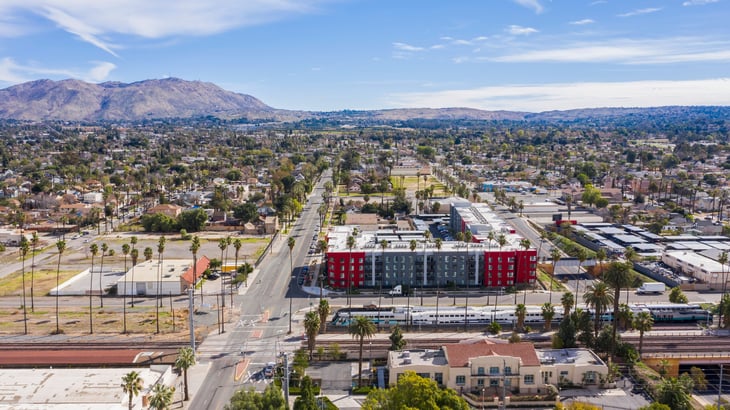
- Percentage change in mortgage applications (2019-2020): +13.3%
- Total change in mortgage applications (2019-2020): +5,307
- Total mortgage applications (2020): 45,066
- Total mortgage applications (2019): 39,759
- Mortgage loan approval rate (2020): 87.5%
- Mortgage loan approval rate (2019): 88.3%
6. Oklahoma City, OK

- Percentage change in mortgage applications (2019-2020): +13.4%
- Total change in mortgage applications (2019-2020): +2,005
- Total mortgage applications (2020): 16,952
- Total mortgage applications (2019): 14,947
- Mortgage loan approval rate (2020): 87.9%
- Mortgage loan approval rate (2019): 89.0%
5. Austin-Round Rock-Georgetown, TX

- Percentage change in mortgage applications (2019-2020): +13.5%
- Total change in mortgage applications (2019-2020): +4,863
- Total mortgage applications (2020): 40,863
- Total mortgage applications (2019): 36,000
- Mortgage loan approval rate (2020): 88.2%
- Mortgage loan approval rate (2019): 88.9%
4. Indianapolis-Carmel-Anderson, IN

- Percentage change in mortgage applications (2019-2020): +13.9%
- Total change in mortgage applications (2019-2020): +3,629
- Total mortgage applications (2020): 29,794
- Total mortgage applications (2019): 26,165
- Mortgage loan approval rate (2020): 92.0%
- Mortgage loan approval rate (2019): 92.5%
3. Baltimore-Columbia-Towson, MD

- Percentage change in mortgage applications (2019-2020): +14.8%
- Total change in mortgage applications (2019-2020): +3,957
- Total mortgage applications (2020): 30,754
- Total mortgage applications (2019): 26,797
- Mortgage loan approval rate (2020): 91.1%
- Mortgage loan approval rate (2019): 91.1%
2. Virginia Beach-Norfolk-Newport News, VA-NC
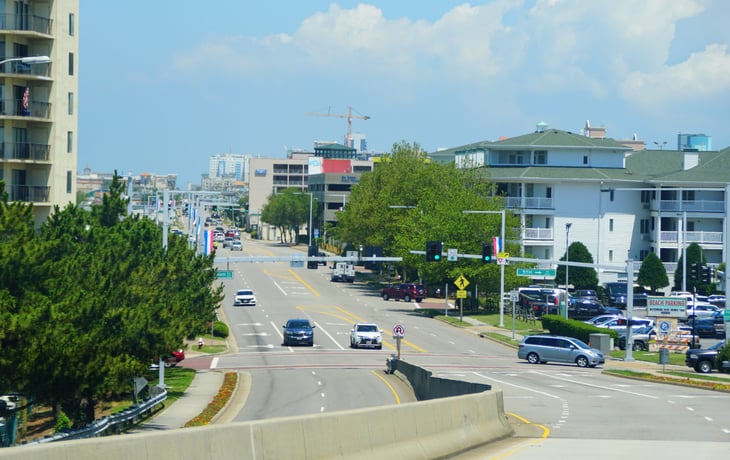
- Percentage change in mortgage applications (2019-2020): +16.6%
- Total change in mortgage applications (2019-2020): +2,373
- Total mortgage applications (2020): 16,673
- Total mortgage applications (2019): 14,300
- Mortgage loan approval rate (2020): 90.8%
- Mortgage loan approval rate (2019): 91.7%
1. Hartford-East Hartford-Middletown, CT

- Percentage change in mortgage applications (2019-2020): +17.8%
- Total change in mortgage applications (2019-2020): +1,892
- Total mortgage applications (2020): 12,497
- Total mortgage applications (2019): 10,605
- Mortgage loan approval rate (2020): 91.9%
- Mortgage loan approval rate (2019): 91.0%
Methodology

The data used in this analysis is from the Federal Financial Institutions Examination Council’s Home Mortgage Disclosure Act. Only conventional, home purchase loans were considered. To determine the locations with the biggest increase in mortgage loans since COVID-19 began spreading, researchers calculated the percentage change in mortgage applications from 2019 to 2020. In the event of a tie, the location with the greater total change in mortgage applications from 2019 to 2020 was ranked higher. To improve relevance, only metropolitan areas with at least 100,000 residents were included.
Add a Comment
Our Policy: We welcome relevant and respectful comments in order to foster healthy and informative discussions. All other comments may be removed. Comments with links are automatically held for moderation.