


Editor's Note: This story originally appeared on Filterbuy.
Income inequality has been a major social, political, and economic issue since the Great Recession, and the uneven effects of the COVID-19 pandemic economy has only made the gaps between America’s haves and have-nots even starker. These divergent economic fortunes will continue to have a major effect on housing in the U.S.
To some extent, however, interest in homeownership has been on a fairly consistent upward trajectory for several years as the post-recession economy improved. In addition to better economic conditions, one underlying driver is the aging of the millennial generation, whose members are currently ages 26 to 40. Many millennials graduated into the worst years of the Great Recession, saddled with more student debt than previous generations. But now, some millennials — America’s largest generational cohort — have firmer economic footing and are reaching an age where they are ready to start families and purchase homes.
Rates of homeownership are also highly dependent on geography. Some locations have a higher cost of living — including higher home prices — that make it more difficult for would-be homeowners to afford to buy. These states include New York, California, and Hawaii, the three states with the lowest rates of homeownership. At the other end of the spectrum, states with greater rates of homeownership have more affordable real estate or a greater concentration of higher-earning, older, and less diverse residents. States with the highest homeownership rates include West Virginia, Delaware, Maine, and Alabama. Similar dynamics are at play at the metro level.
Large Metros With the Highest Homeownership Rates

The data used in this analysis is from the U.S. Census Bureau, U.S. Bureau of Economic Analysis, and Zillow. To determine the locations with the highest homeownership rates, researchers at Filterbuy reported the average annual homeownership rate for 2020. In the event of a tie, the location with the greater number of total owner-occupied housing units was ranked higher. Only the 75 largest U.S. metropolitan areas with available data were considered in the analysis.
Here are the large metros with the highest homeownership rates.
15. Baltimore-Columbia-Towson, MD

- Homeownership rate 2020: 70.7%
- Homeownership rate 2016: 68.5%
- Percentage point change in homeownership rate since 2016: +2.2
- Total owner-occupied housing units: 751,471
- Median home price: $345,194
- Cost of living (compared to average): +5.8%
14. Cincinnati, OH-KY-IN

- Homeownership rate 2020: 71.1%
- Homeownership rate 2016: 64.9%
- Percentage point change in homeownership rate since 2016: +6.2
- Total owner-occupied housing units: 624,717
- Median home price: $228,977
- Cost of living (compared to average): -9.4%
13. St. Louis, MO-IL

- Homeownership rate 2020: 71.1%
- Homeownership rate 2016: 66.4%
- Percentage point change in homeownership rate since 2016: +4.7
- Total owner-occupied housing units: 814,510
- Median home price: $216,727
- Cost of living (compared to average): -9.9%

12. Syracuse, NY
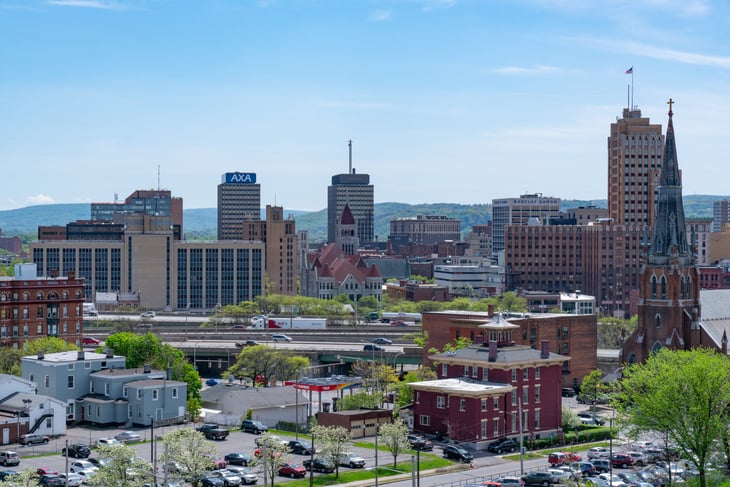
- Homeownership rate 2020: 71.4%
- Homeownership rate 2016: 61.0%
- Percentage point change in homeownership rate since 2016: +10.4
- Total owner-occupied housing units: 182,673
- Median home price: $176,156
- Cost of living (compared to average): -4.0%
11. Dayton, OH

- Homeownership rate 2020: 71.4%
- Homeownership rate 2016: 66.0%
- Percentage point change in homeownership rate since 2016: +5.4
- Total owner-occupied housing units: 237,232
- Median home price: $168,433
- Cost of living (compared to average): -12.4%
10. Grand Rapids-Wyoming, MI
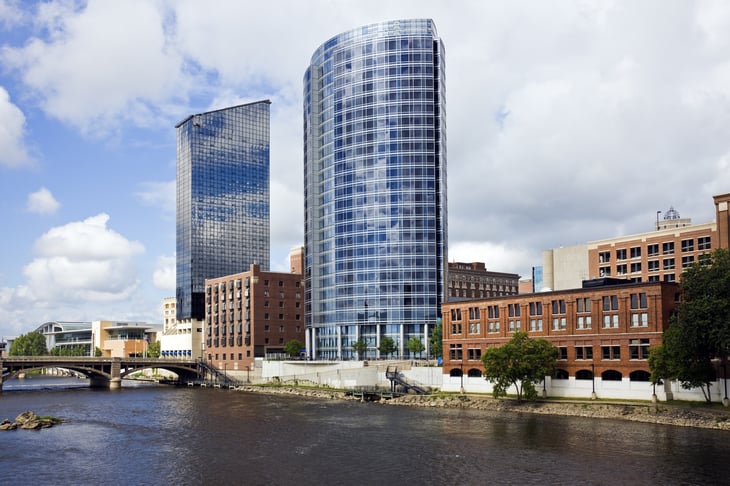
- Homeownership rate 2020: 71.8%
- Homeownership rate 2016: 76.2%
- Percentage point change in homeownership rate since 2016: -4.4
- Total owner-occupied housing units: 284,876
- Median home price: $267,929
- Cost of living (compared to average): -8.0%
9. Detroit-Warren-Dearborn, MI

- Homeownership rate 2020: 71.8%
- Homeownership rate 2016: 71.6%
- Percentage point change in homeownership rate since 2016: +0.2
- Total owner-occupied housing units: 1,235,398
- Median home price: $220,309
- Cost of living (compared to average): -4.7%
8. Baton Rouge, LA

- Homeownership rate 2020: 72.1%
- Homeownership rate 2016: 64.8%
- Percentage point change in homeownership rate since 2016: +7.3
- Total owner-occupied housing units: 220,223
- Median home price: $206,095
- Cost of living (compared to average): -9.5%
7. Tampa-St Petersburg-Clearwater, FL

- Homeownership rate 2020: 72.2%
- Homeownership rate 2016: 62.9%
- Percentage point change in homeownership rate since 2016: +9.3
- Total owner-occupied housing units: 886,963
- Median home price: $295,532
- Cost of living (compared to average): -1.2%
6. Minneapolis-St Paul-Bloomington, MN-WI

- Homeownership rate 2020: 73.0%
- Homeownership rate 2016: 69.1%
- Percentage point change in homeownership rate since 2016: +3.9
- Total owner-occupied housing units: 1,019,098
- Median home price: $347,512
- Cost of living (compared to average): +2.9%
5. Charlotte-Concord-Gastonia, NC-SC

- Homeownership rate 2020: 73.3%
- Homeownership rate 2016: 66.2%
- Percentage point change in homeownership rate since 2016: +7.1
- Total owner-occupied housing units: 719,983
- Median home price: $303,816
- Cost of living (compared to average): -5.6%
4. Charleston-North Charleston-Summerville, SC
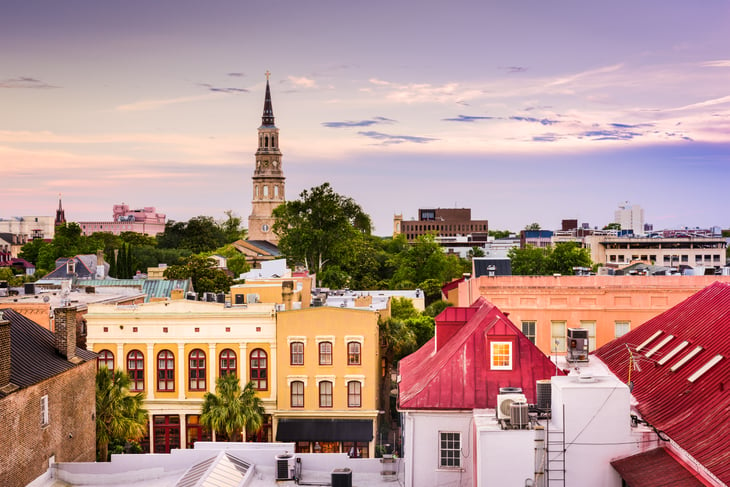
- Homeownership rate 2020: 75.5%
- Homeownership rate 2016: 62.1%
- Percentage point change in homeownership rate since 2016: +13.4
- Total owner-occupied housing units: 229,502
- Median home price: $332,240
- Cost of living (compared to average): -2.9%
3. North Port-Bradenton-Sarasota, FL

- Homeownership rate 2020: 75.8%
- Homeownership rate 2016: 73.4%
- Percentage point change in homeownership rate since 2016: +2.4
- Total owner-occupied housing units: 252,097
- Median home price: $351,845
- Cost of living (compared to average): +0.8%

2. Birmingham-Hoover, AL

- Homeownership rate 2020: 76.0%
- Homeownership rate 2016: 68.7%
- Percentage point change in homeownership rate since 2016: +7.3
- Total owner-occupied housing units: 325,785
- Median home price: $204,114
- Cost of living (compared to average): -11.7%
1. Cape Coral-Fort Myers, FL
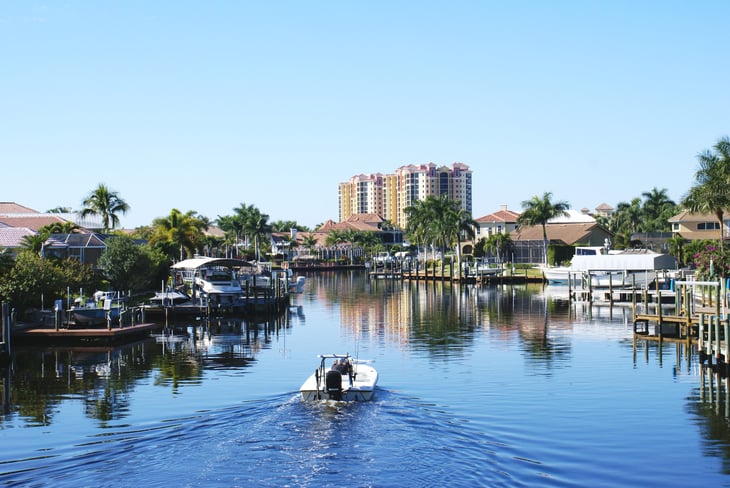
- Homeownership rate 2020: 77.4%
- Homeownership rate 2016: 66.5%
- Percentage point change in homeownership rate since 2016: +10.9
- Total owner-occupied housing units: 222,051
- Median home price: $306,374
- Cost of living (compared to average): -2.3%
Detailed Findings & Methodology

The data used in this analysis is from the U.S. Census Bureau Housing Vacancies and Homeownership tables, the U.S. Census Bureau American Community Survey, Zillow Housing Data, and the U.S. Bureau of Economic Analysis Regional Price Parities dataset. To determine the locations with the highest homeownership rates, researchers reported the annual homeownership rate for 2020. In the event of a tie, the location with the highest number of total owner-occupied housing units was ranked higher. Only the 75 largest U.S. metropolitan areas with available data were considered in the analysis.
Add a Comment
Our Policy: We welcome relevant and respectful comments in order to foster healthy and informative discussions. All other comments may be removed. Comments with links are automatically held for moderation.