


Editor's Note: This story originally appeared on Self.
During the COVID-19 pandemic, the U.S. government has pumped unprecedented amounts of financial relief to American households to stave off a potential economic disaster.
From the expansions of social safety net programs like unemployment insurance and food stamps to multiple rounds of direct payments, Congress’ multiple relief packages over the last year have helped put many households on better financial footing.
Early analysis of these policies indicates that one of the groups benefiting most from these relief efforts is America’s poverty-stricken citizens. One recent report from the Urban Institute estimated that as a result of these investments, America’s poverty rate will decline to 7.7% in 2021, which would be the lowest rate on record.
This drop in the poverty rate would represent an acceleration of a more gradual trend that has taken place for the last few years. The poverty rate rose to nearly 16% in the wake of the Great Recession of 2007-2009.
By 2019, after a steady but slow economic recovery over the previous decade, the poverty rate had fallen to 12.3%. But while the overall trends are promising, this figure still represents approximately 40 million Americans, and poverty hits some populations harder than others.
To find the cities with the highest poverty rates, researchers at Self analyzed data from the U.S> Census Bureau’s American Community Survey. Researchers examined poverty rates for all cities with at least 100,000 residents and collected data on both the percentage and number of people living in poverty overall and for children and racial or ethnic minorities.
Here are the cities with the highest poverty rates.
15. Dallas, TX
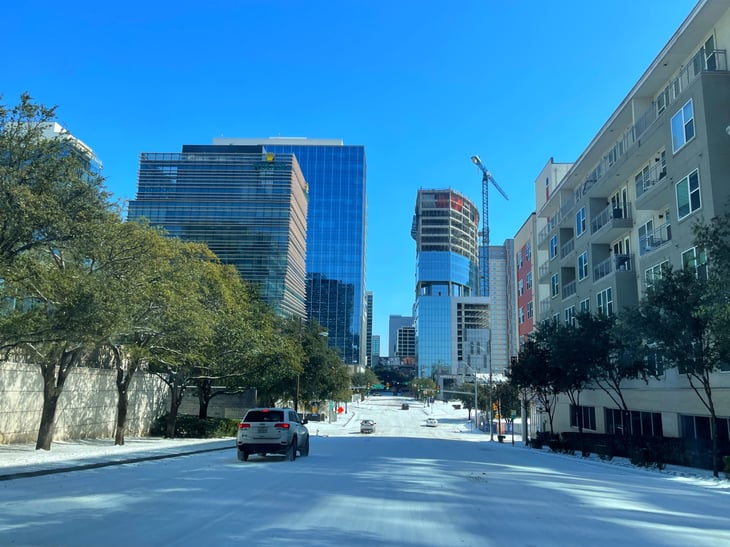
- Overall poverty rate: 17.5%
- Child poverty rate: 27.8%
- Minority poverty rate: 21.5%
- Total residents below the poverty level: 232,209
- Total children below the poverty level: 91,035
- Total minority residents below the poverty level: 203,210
14. El Paso, TX

- Overall poverty rate: 18.6%
- Child poverty rate: 26.9%
- Minority poverty rate: 19.7%
- Total residents below the poverty level: 125,140
- Total children below the poverty level: 47,771
- Total minority residents below the poverty level: 116,228

13. Tulsa, OK

- Overall poverty rate: 18.6%
- Child poverty rate: 27.1%
- Minority poverty rate: 27.0%
- Total residents below the poverty level: 73,586
- Total children below the poverty level: 26,546
- Total minority residents below the poverty level: 48,805
12. Tucson, AZ
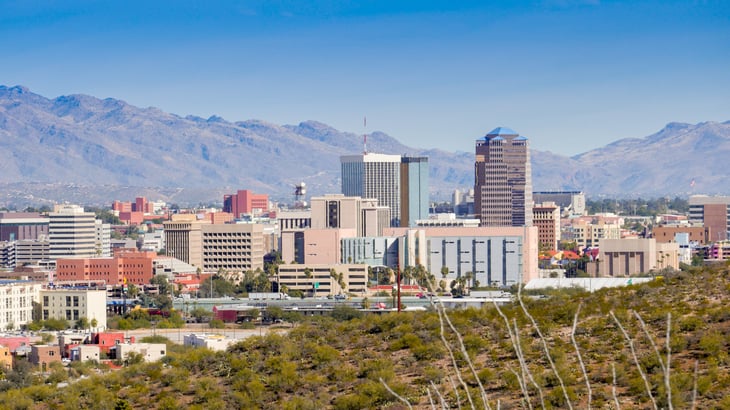
- Overall poverty rate: 19.1%
- Child poverty rate: 25.8%
- Minority poverty rate: 22.0%
- Total residents below the poverty level: 99,524
- Total children below the poverty level: 27,709
- Total minority residents below the poverty level: 67,414
11. Houston, TX

- Overall poverty rate: 19.7%
- Child poverty rate: 28.9%
- Minority poverty rate: 23.3%
- Total residents below the poverty level: 449,733
- Total children below the poverty level: 163,139
- Total minority residents below the poverty level: 408,445
10. Baltimore, MD

- Overall poverty rate: 20.2%
- Child poverty rate: 30.5%
- Minority poverty rate: 24.0%
- Total residents below the poverty level: 115,472
- Total children below the poverty level: 35,834
- Total minority residents below the poverty level: 99,772
9. Atlanta, GA

- Overall poverty rate: 20.2%
- Child poverty rate: 34.9%
- Minority poverty rate: 28.7%
- Total residents below the poverty level: 95,034
- Total children below the poverty level: 29,729
- Total minority residents below the poverty level: 82,132
8. Miami, FL

- Overall poverty rate: 20.3%
- Child poverty rate: 25.6%
- Minority poverty rate: 22.2%
- Total residents below the poverty level: 94,209
- Total children below the poverty level: 20,409
- Total minority residents below the poverty level: 89,054
7. Memphis, TN

- Overall poverty rate: 21.7%
- Child poverty rate: 35.0%
- Minority poverty rate: 26.0%
- Total residents below the poverty level: 137,977
- Total children below the poverty level: 53,531
- Total minority residents below the poverty level: 122,624
6. Milwaukee, WI

- Overall poverty rate: 22.4%
- Child poverty rate: 32.6%
- Minority poverty rate: 27.4%
- Total residents below the poverty level: 128,555
- Total children below the poverty level: 47,314
- Total minority residents below the poverty level: 103,372
5. New Orleans, LA

- Overall poverty rate: 23.2%
- Child poverty rate: 33.1%
- Minority poverty rate: 29.2%
- Total residents below the poverty level: 88,044
- Total children below the poverty level: 25,143
- Total minority residents below the poverty level: 76,819
4. Fresno, CA

- Overall poverty rate: 23.2%
- Child poverty rate: 32.2%
- Minority poverty rate: 26.7%
- Total residents below the poverty level: 121,007
- Total children below the poverty level: 46,993
- Total minority residents below the poverty level: 102,304
3. Philadelphia, PA

- Overall poverty rate: 23.3%
- Child poverty rate: 32.1%
- Minority poverty rate: 28.8%
- Total residents below the poverty level: 359,011
- Total children below the poverty level: 106,909
- Total minority residents below the poverty level: 292,706
2. Detroit, MI
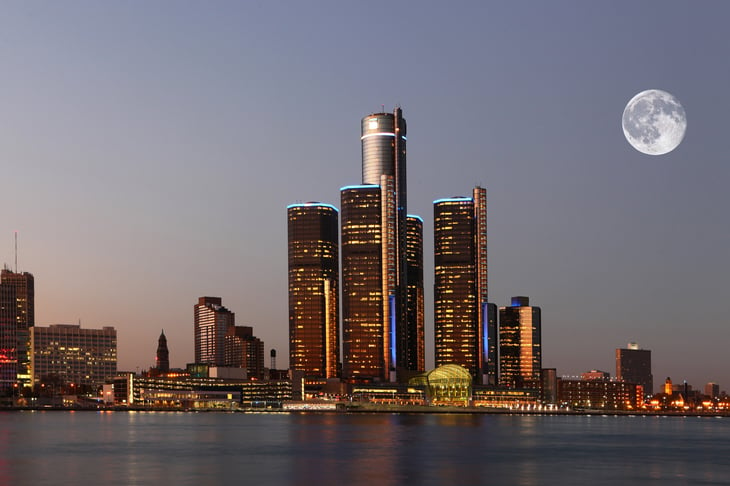
- Overall poverty rate: 30.6%
- Child poverty rate: 43.2%
- Minority poverty rate: 30.7%
- Total residents below the poverty level: 201,766
- Total children below the poverty level: 70,713
- Total minority residents below the poverty level: 182,035
1. Cleveland, OH

- Overall poverty rate: 30.8%
- Child poverty rate: 46.1%
- Minority poverty rate: 36.3%
- Total residents below the poverty level: 114,309
- Total children below the poverty level: 37,664
- Total minority residents below the poverty level: 91,786
Methodology

Poverty rates by age, race, and over time are from the U.S. Census Bureau’s American Community Survey.
To identify which locations have the highest poverty rates, researchers looked at the overall poverty rate for all cities with at least 100,000 residents.
Add a Comment
Our Policy: We welcome relevant and respectful comments in order to foster healthy and informative discussions. All other comments may be removed. Comments with links are automatically held for moderation.