


Editor's Note: This story originally appeared on Porch.
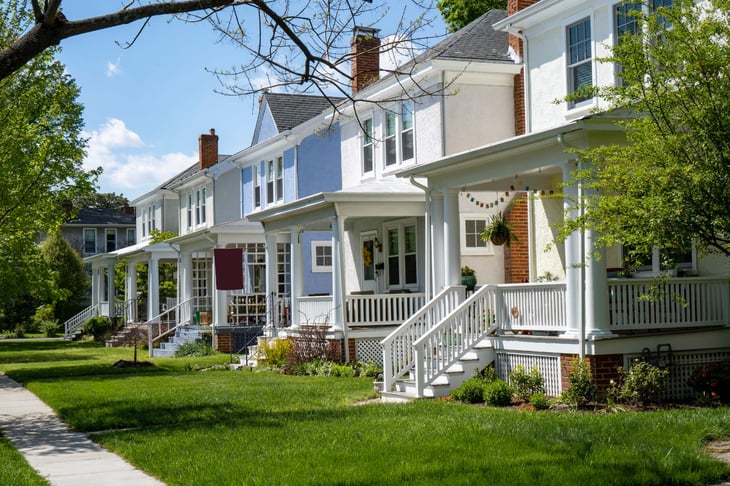
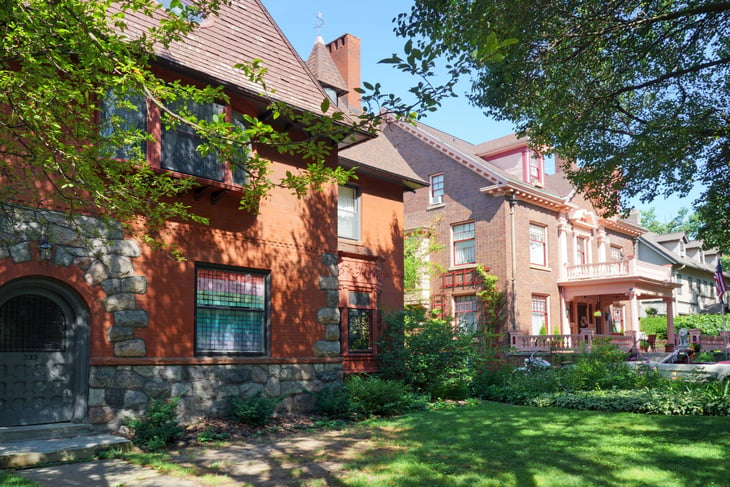
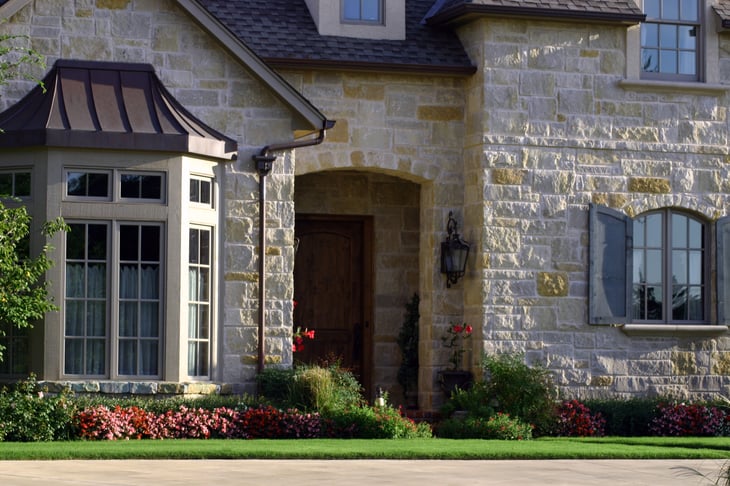
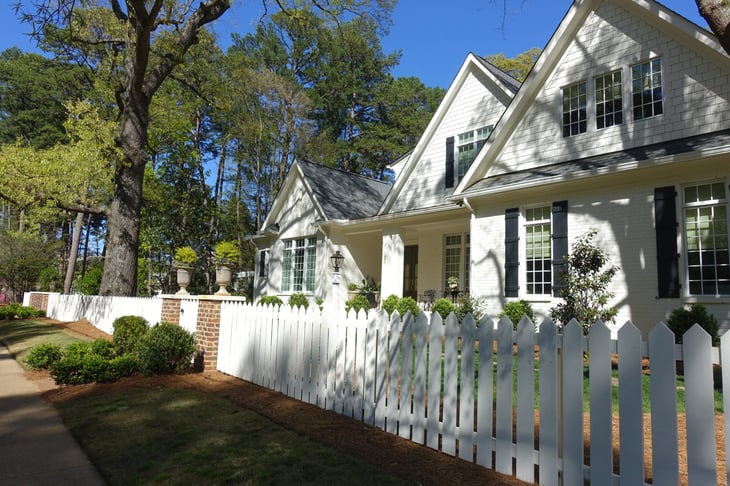
The classic saying in real estate is “Location, location, location.” Everyone who buys a home knows that where homes are located — by market, by neighborhood, and even by block — can cause wide variation in what they will list and ultimately sell for.
Changes in the real estate market during the COVID-19 pandemic have shifted some of the calculus when it comes to choosing both the location and the particular home. On the one hand, low interest rates have increased the amount of money buyers are willing to spend, as evidenced in part by the ratio of contractor-built to owner-built housing starts. When interest rates are high, many potential buyers opt to build their own home as a way to save money, pushing the ratio down. Conversely, when interest rates are low, buyers are more willing to pay a premium on a home that someone else built, and the ratio rises.
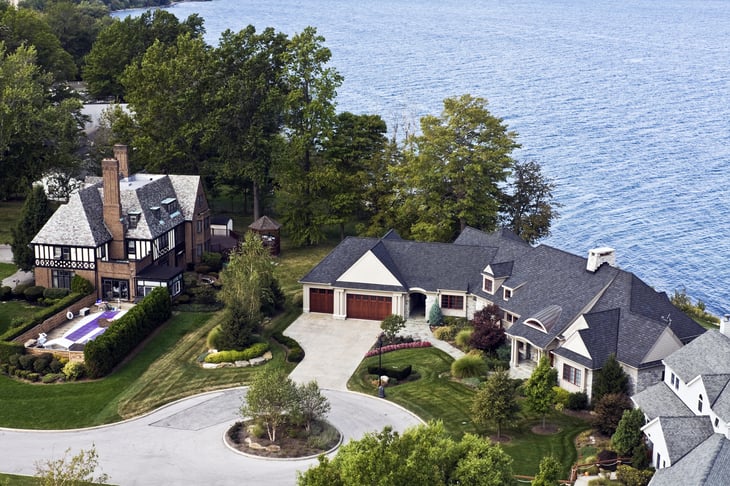
Alongside lower mortgage rates and the corresponding increase in what buyers are willing to spend, COVID-19 has ushered in a resurgence of interest in large homes. With more people transitioning to virtual work and schooling, many previously high-demand markets have cooled off, while lower-cost markets offering larger houses and more “bang-for-the-buck” have new appeal.
Large metros offering the best “bang-for-the-buck”

To find the real estate markets where buyers can get the most for their money, researchers at Porch analyzed data from Zillow, Realtor.com, and the U.S. Census Bureau. They created a composite score based on five key metrics related to price, affordability, home size, and the recent and projected changes in value.
At the state level, Kansas leads the nation by a large margin, followed by a number of other lower-cost states in the South and Midwest. Notably absent from the top of the list are coastal states like California and Massachusetts, where price per square foot and home payments as a share of income are much higher than in the rest of the country.
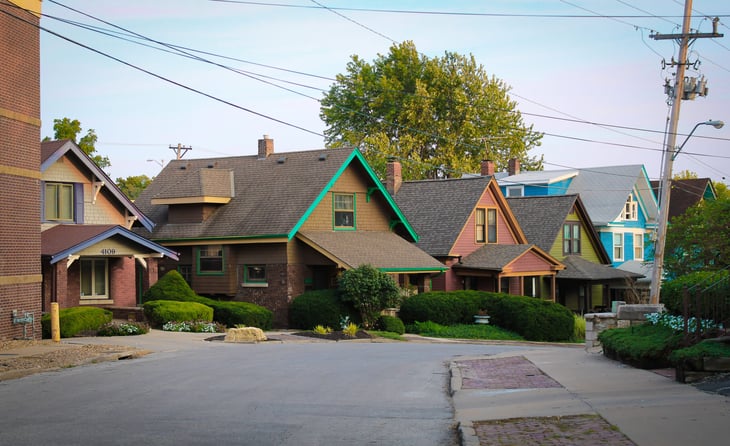
At the metro level, it is unsurprising to find that many of the best bang-for-the-buck markets are located in the same states that rate highly for value. Oft-overlooked large metros like Indianapolis, Kansas City, and Cleveland top the list, a function of low housing costs both on a per-square-foot basis and as a share of income.
Here are the best large “bang-for-the-buck” real estate markets.
15. Phoenix, AZ
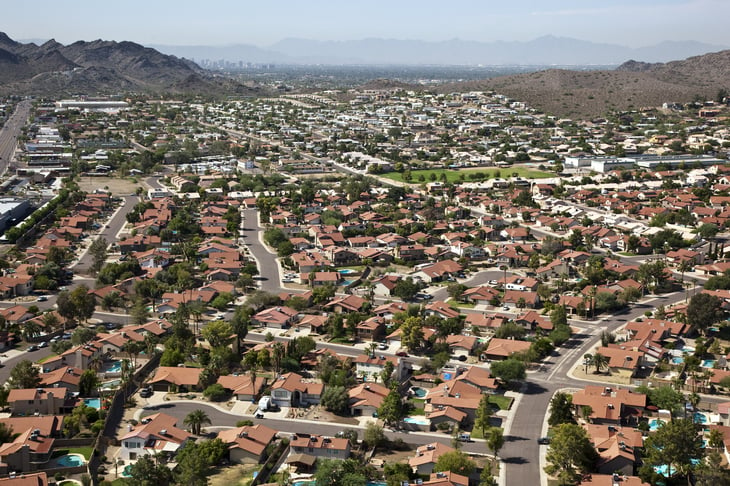
- Composite score: 78.6
- Median list price: $403,792
- Price per square foot: $201.21
- Monthly mortgage payment as a percentage of household income: 25.9%
- Median home size (square feet): 2,121
- Previous 1-year change in home price: +7.9%
- Projected 1-year change in home price: +16.1%
14. Rochester, NY

- Composite score: 78.8
- Median list price: $236,986
- Price per square foot: $125.99
- Monthly mortgage payment as a percentage of household income: 16.2%
- Median home size (square feet): 1,761
- Previous 1-year change in home price: +11.3%
- Projected 1-year change in home price: +8.9%

13. Richmond, VA
- Composite score: 79.2
- Median list price: $347,950
- Price per square foot: $156.34
- Monthly mortgage payment as a percentage of household income: 20.8%
- Median home size (square feet): 2,207
- Previous 1-year change in home price: +7.5%
- Projected 1-year change in home price: +10.1%
12. Grand Rapids, MI
- Composite score: 79.5
- Median list price: $306,125
- Price per square foot: $150.52
- Monthly mortgage payment as a percentage of household income: 19.8%
- Median home size (square feet): 2,018
- Previous 1-year change in home price: +6.4%
- Projected 1-year change in home price: +12.0%
11. San Antonio, TX

- Composite score: 79.9
- Median list price: $301,805
- Price per square foot: $144.93
- Monthly mortgage payment as a percentage of household income: 20.5%
- Median home size (square feet): 2,220
- Previous 1-year change in home price: +1.7%
- Projected 1-year change in home price: +11.1%
10. Oklahoma City, OK
- Composite score: 80.0
- Median list price: $268,581
- Price per square foot: $130.13
- Monthly mortgage payment as a percentage of household income: 18.7%
- Median home size (square feet): 2,105
- Previous 1-year change in home price: +7.7%
- Projected 1-year change in home price: +8.1%
9. Dallas-Fort Worth, TX
- Composite score: 81.1
- Median list price: $351,276
- Price per square foot: $152.27
- Monthly mortgage payment as a percentage of household income: 20.5%
- Median home size (square feet): 2,320
- Previous 1-year change in home price: +1.0%
- Projected 1-year change in home price: +12.6%
8. Houston, TX
- Composite score: 82.1
- Median list price: $322,206
- Price per square foot: $136.89
- Monthly mortgage payment as a percentage of household income: 19.6%
- Median home size (square feet): 2,368
- Previous 1-year change in home price: +2.7%
- Projected 1-year change in home price: +10.8%
7. Birmingham, AL
- Composite score: 82.9
- Median list price: $263,736
- Price per square foot: $122.40
- Monthly mortgage payment as a percentage of household income: 18.8%
- Median home size (square feet): 2,091
- Previous 1-year change in home price: +5.7%
- Projected 1-year change in home price: +11.7%
6. Charlotte, NC
- Composite score: 83.1
- Median list price: $358,347
- Price per square foot: $153.40
- Monthly mortgage payment as a percentage of household income: 23.3%
- Median home size (square feet): 2,331
- Previous 1-year change in home price: +5.1%
- Projected 1-year change in home price: +15.1%
5. Salt Lake City, UT

- Composite score: 83.1
- Median list price: $491,591
- Price per square foot: $191.74
- Monthly mortgage payment as a percentage of household income: 27.0%
- Median home size (square feet): 2,664
- Previous 1-year change in home price: +13.4%
- Projected 1-year change in home price: +16.0%
4. Raleigh, NC
- Composite score: 83.2
- Median list price: $378,824
- Price per square foot: $154.92
- Monthly mortgage payment as a percentage of household income: 20.5%
- Median home size (square feet): 2,480
- Previous 1-year change in home price: +3.4%
- Projected 1-year change in home price: +14.0%
3. Cleveland, OH
- Composite score: 83.8
- Median list price: $208,061
- Price per square foot: $98.97
- Monthly mortgage payment as a percentage of household income: 15.2%
- Median home size (square feet): 1,901
- Previous 1-year change in home price: +6.2%
- Projected 1-year change in home price: +10.4%
2. Kansas City, MO
- Composite score: 84.6
- Median list price: $338,726
- Price per square foot: $145.98
- Monthly mortgage payment as a percentage of household income: 20.9%
- Median home size (square feet): 2,294
- Previous 1-year change in home price: +9.3%
- Projected 1-year change in home price: +14.8%
1. Indianapolis, IN
- Composite score: 87.0
- Median list price: $283,562
- Price per square foot: $113.70
- Monthly mortgage payment as a percentage of household income: 18.9%
- Median home size (square feet): 2,308
- Previous 1-year change in home price: +5.5%
- Projected 1-year change in home price: +14.1%

Detailed findings & methodology

The data used in this analysis is from Zillow, Realtor.com, and the U.S. Census Bureau. To determine the best “bang-for-the-buck” real estate markets, researchers created a composite score based on the following factors and weights:
- Price per square foot (40%) – the median price per square foot for 2020
- Monthly mortgage payment as a percentage of household income (10%) – the estimated monthly mortgage payment based on the median list price and median household income; assuming a 30-year fixed rate mortgage with a 20% down payment
- Median home size (20%) – the median home size in square feet for 2020
- Previous 1-year change in home price (5%) – the average monthly year-over-year change in list price for 2020
- Projected 1-year change in home price (25%)* – the forecasted one-year change in home price from Zillow
With the exception of the monthly mortgage payment as a percentage of household income, higher values corresponded to a higher score for all factors considered. In the event of a tie, the metro with the lower median listing price was ranked higher. To improve relevance, only metropolitan areas with at least 100,000 residents were included.
*Not available for U.S. states.
Add a Comment
Our Policy: We welcome relevant and respectful comments in order to foster healthy and informative discussions. All other comments may be removed. Comments with links are automatically held for moderation.