


Editor's Note: This story originally appeared on CoPilot.
One of the most significant economic stories of recent months has been the rapid growth in inflation.
Recent Consumer Price Index data from the U.S. Bureau of Labor Statistics revealed that consumer prices increased by 7.5% from January 2021 to January 2022. These figures continued a trend of historically unusual month-over-month and year-over-year price increases dating back to the spring of 2021.
Many economists attribute the current period of inflation to several factors related to the pandemic. One is robust government stimulus: Through a series of relief efforts, the federal government has pumped money into the economy over the last two years to support businesses and households through interruptions from COVID-19.
The relative strength of the economy has given households more money to spend, and this has helped boost consumer demand. In particular, consumers are spending more on physical products than on services. However, ongoing challenges with the global supply chain have made it difficult to manufacture and ship products amid this increased demand. With supply unable to keep up with demand, many categories are seeing prices rise.
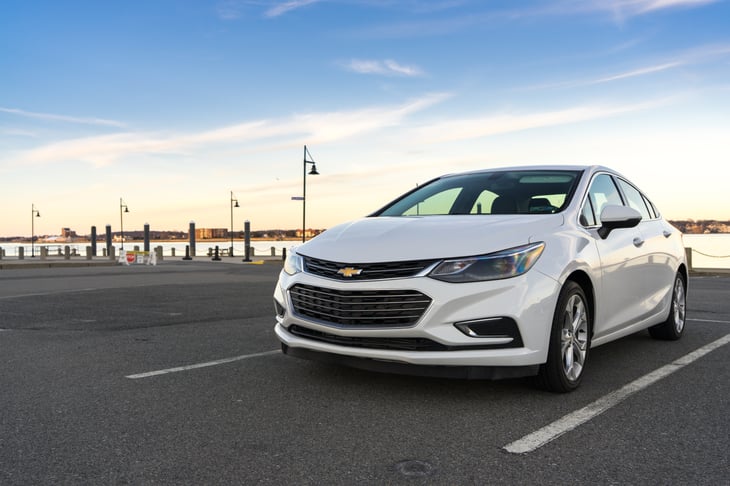
One of the categories in which these dynamics have been felt most strongly is the market for new and used cars. Demand for vehicles has shifted sharply during the pandemic, dropping early in 2020 but recovering to near pre-pandemic levels since.
The data used in this analysis is from the U.S. Bureau of Economic Analysis 2020 Personal Consumption Expenditures. To identify the states spending the most on used compared with new cars, researchers at CoPilot calculated the percentage of all vehicle sales (in dollars) accounted for by used vehicle purchases. In the event of a tie, the state with the greater amount of used car spending per capita was ranked higher.
Here are the states where people are spending the most on used versus new vehicles.
15. Washington
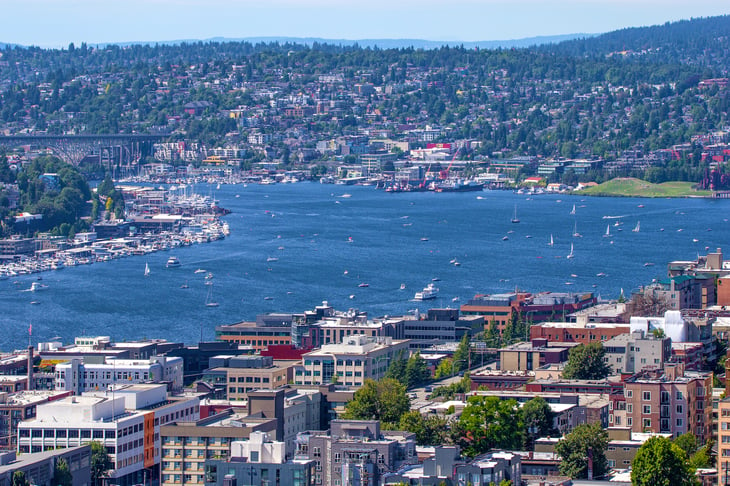
- Used as a share of total vehicle purchase value: 41.42%
- Used vehicle spending per capita: $501
- Total used vehicle spending: $3,856,200,000
- Total new vehicle spending: $5,454,500,000
14. New Mexico
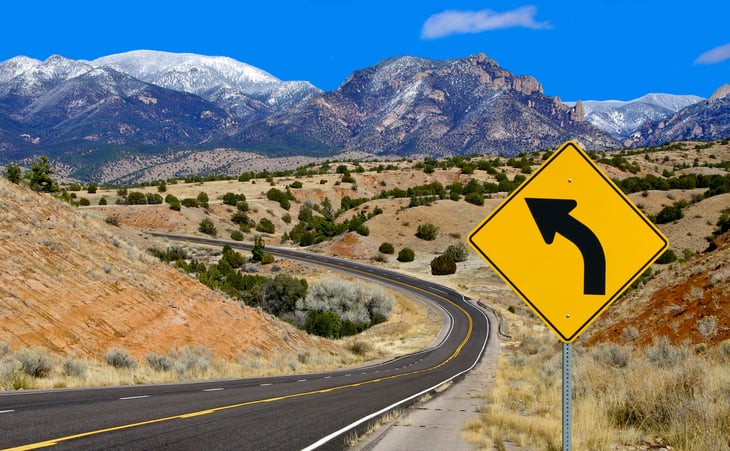
- Used as a share of total vehicle purchase value: 41.44%
- Used vehicle spending per capita: $568
- Total used vehicle spending: $1,195,700,000
- Total new vehicle spending: $1,690,000,000

13. Tennessee
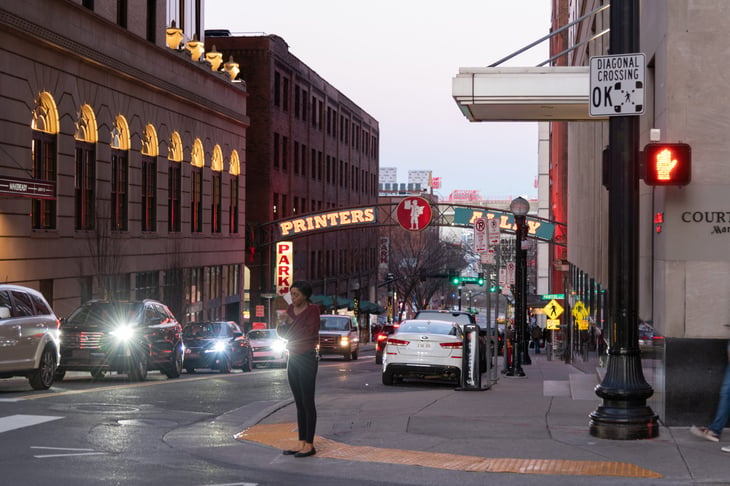
- Used as a share of total vehicle purchase value: 41.51%
- Used vehicle spending per capita: $590
- Total used vehicle spending: $4,066,600,000
- Total new vehicle spending: $5,729,800,000
12. Nebraska
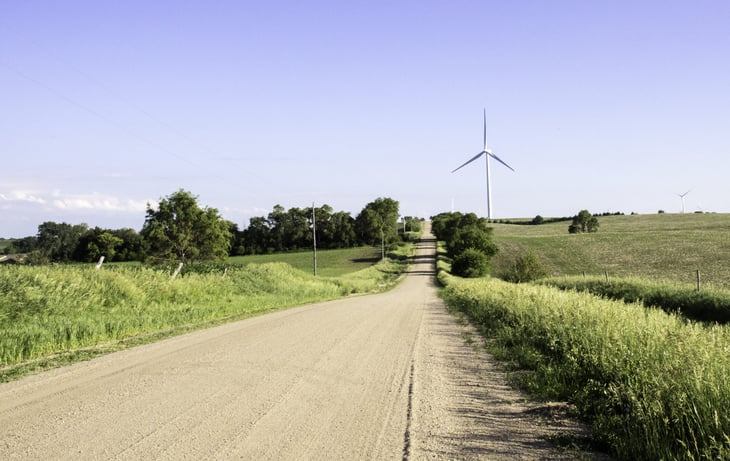
- Used as a share of total vehicle purchase value: 41.78%
- Used vehicle spending per capita: $847
- Total used vehicle spending: $1,641,800,000
- Total new vehicle spending: $2,287,900,000
11. Montana
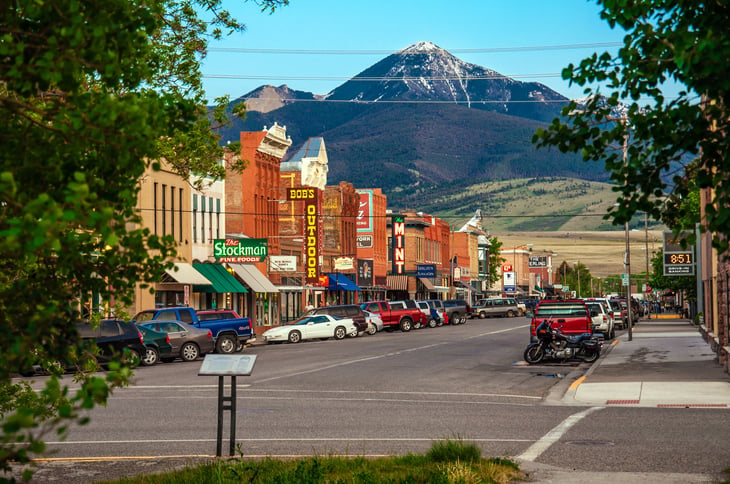
- Used as a share of total vehicle purchase value: 41.84%
- Used vehicle spending per capita: $803
- Total used vehicle spending: $867,800,000
- Total new vehicle spending: $1,206,500,000
10. Utah
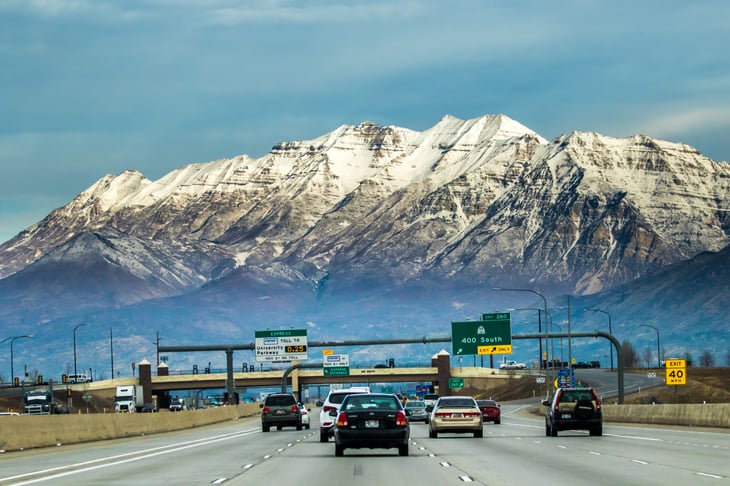
- Used as a share of total vehicle purchase value: 43.29%
- Used vehicle spending per capita: $735
- Total used vehicle spending: $2,389,300,000
- Total new vehicle spending: $3,130,200,000
9. Wisconsin
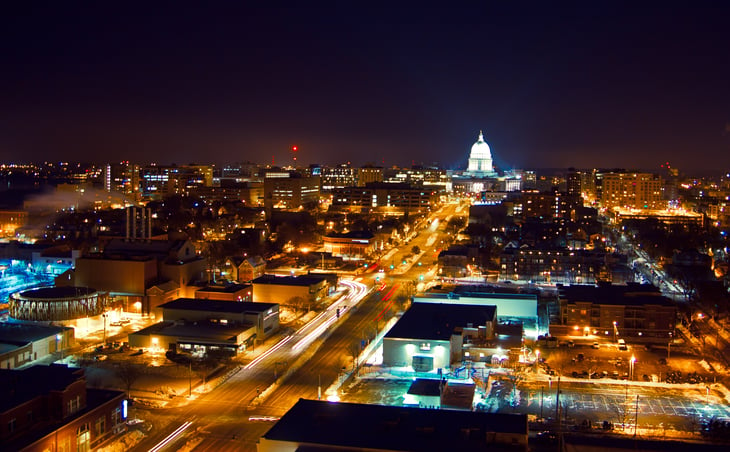
- Used as a share of total vehicle purchase value: 43.33%
- Used vehicle spending per capita: $699
- Total used vehicle spending: $4,075,000,000
- Total new vehicle spending: $5,330,300,000
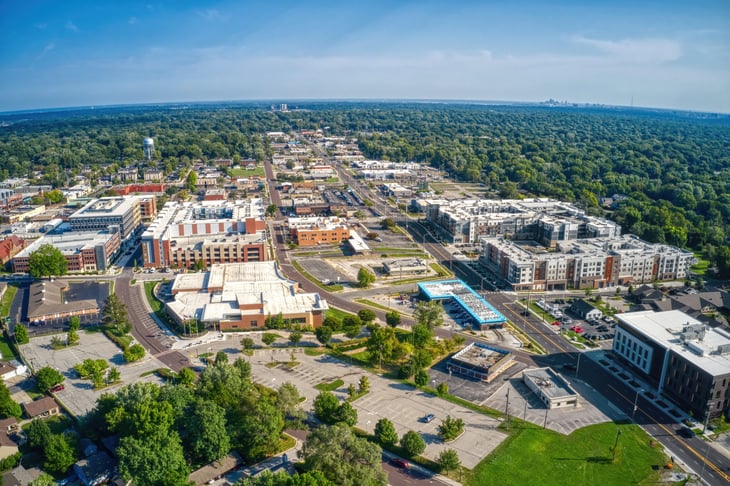
8. Indiana

- Used as a share of total vehicle purchase value: 44.34%
- Used vehicle spending per capita: $662
- Total used vehicle spending: $4,470,000,000
- Total new vehicle spending: $5,610,200,000
7. Kansas
- Used as a share of total vehicle purchase value: 44.61%
- Used vehicle spending per capita: $687
- Total used vehicle spending: $2,002,400,000
- Total new vehicle spending: $2,486,500,000
6. Minnesota
- Used as a share of total vehicle purchase value: 44.72%
- Used vehicle spending per capita: $754
- Total used vehicle spending: $4,267,600,000
- Total new vehicle spending: $5,274,300,000
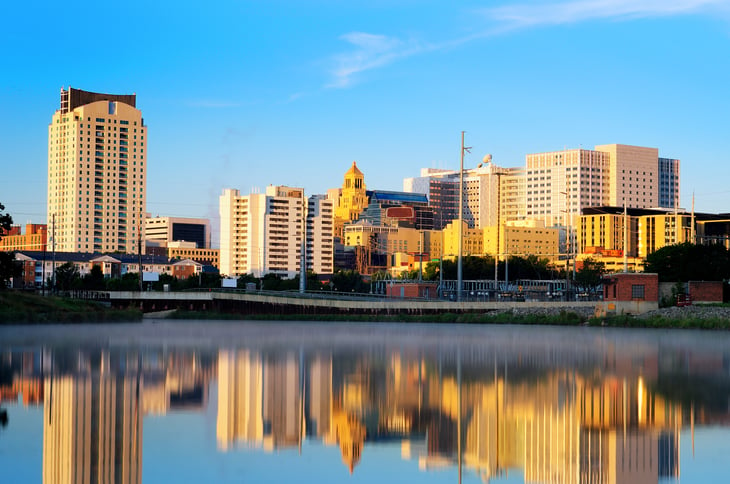
5. Iowa
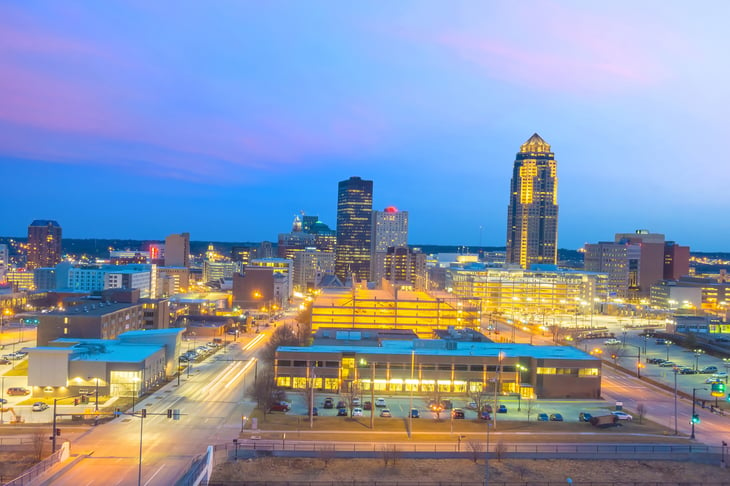
- Used as a share of total vehicle purchase value: 45.83%
- Used vehicle spending per capita: $892
- Total used vehicle spending: $2,821,200,000
- Total new vehicle spending: $3,334,700,000
4. Kentucky
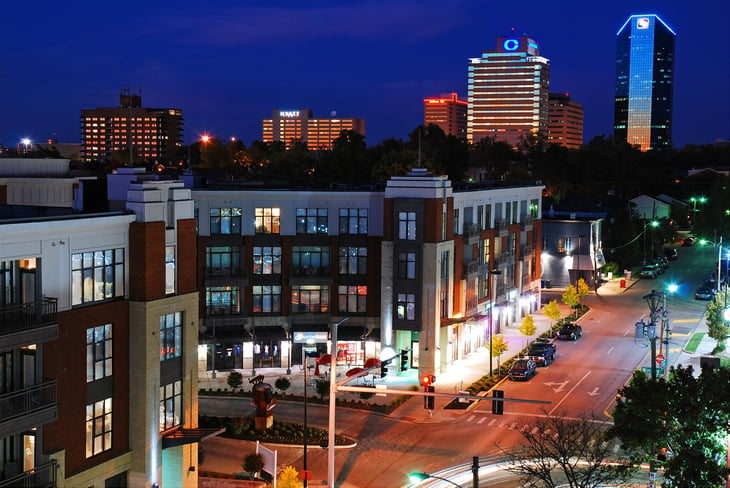
- Used as a share of total vehicle purchase value: 45.96%
- Used vehicle spending per capita: $626
- Total used vehicle spending: $2,800,700,000
- Total new vehicle spending: $3,293,500,000
3. Rhode Island
- Used as a share of total vehicle purchase value: 46.69%
- Used vehicle spending per capita: $575
- Total used vehicle spending: $607,600,000
- Total new vehicle spending: $693,700,000
2. North Dakota
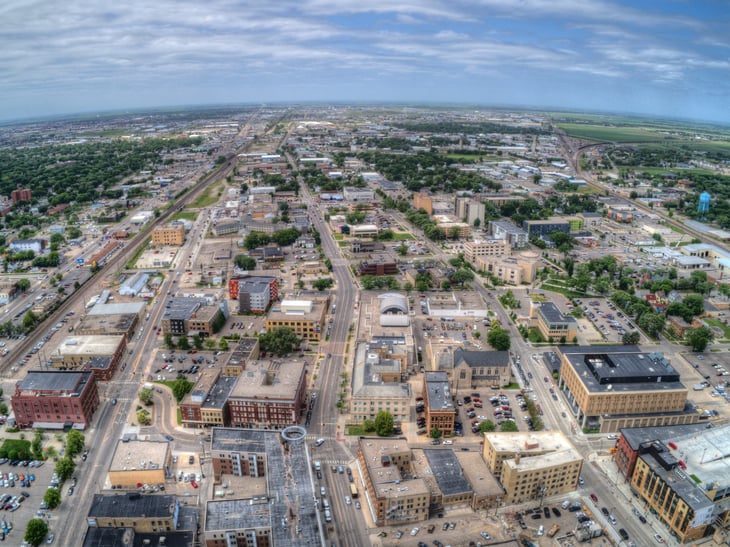
- Used as a share of total vehicle purchase value: 47.80%
- Used vehicle spending per capita: $843
- Total used vehicle spending: $645,500,000
- Total new vehicle spending: $705,000,000
1. South Dakota
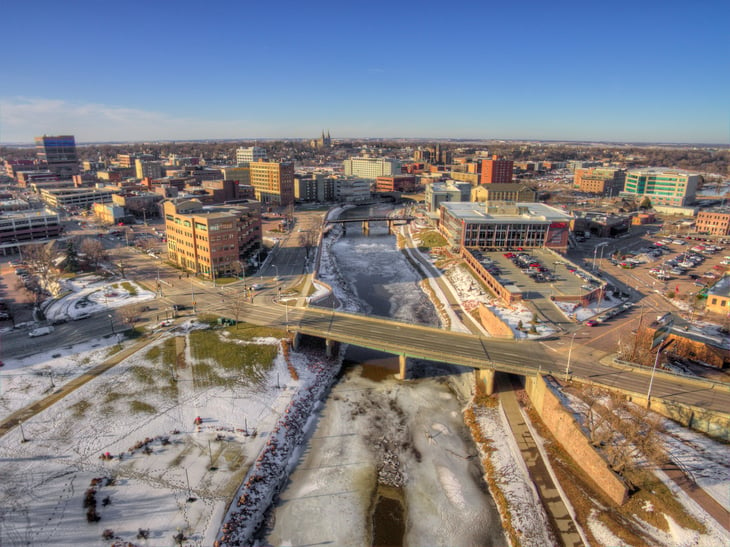
- Used as a share of total vehicle purchase value: 48.35%
- Used vehicle spending per capita: $708
- Total used vehicle spending: $631,600,000
- Total new vehicle spending: $674,700,000
Methodology

The data used in this analysis is from the U.S. Bureau of Economic Analysis 2020 Personal Consumption Expenditures.
To identify the states spending the most on used versus new cars, researchers calculated the percentage of all vehicle sales (in dollars) accounted for by used vehicle purchases. In the event of a tie, the state with the greater amount of used car spending per capita was ranked higher.
Add a Comment
Our Policy: We welcome relevant and respectful comments in order to foster healthy and informative discussions. All other comments may be removed. Comments with links are automatically held for moderation.