


Editor's Note: This story originally appeared on CoPilot.
Inflation has been the dominant story in the U.S. economy for most of the last year. Year-over-year increases in the Consumer Price Index have reached their highest levels in 40 years, with consumers paying more for expenses from food to housing to energy.
And one of the categories that has consistently seen the highest price increases in this inflationary period is vehicles, both new and used.
While the early months of the COVID-19 pandemic saw lower demand for vehicles as people avoided travel and commuting, the vehicle market has rebounded strongly since the second half of 2020. Pandemic-related concerns and transitions to remote or hybrid work have put a dent in public transit ridership, and instead, more former transit users have opted to buy cars.
Low interest rates, strong government stimulus, and a rebounding economy have given many households the wherewithal to make vehicle purchases. A lingering challenge, however, has been supply. COVID-19 outbreaks over the last two years have disrupted global supply chains, and carmakers have been particularly hard hit.
To determine the states with the biggest increase in used vehicle purchases during COVID-19, researchers at CoPilot calculated the percentage change in total used car spending from 2019 to 2020.
The data used in this analysis is from the U.S. Bureau of Economic Analysis’s Personal Consumption Expenditures. In the event of a tie, the state with the greater total change in used car spending over the same time period was ranked higher.
Here are the states with the biggest increase in used vehicle purchases during the pandemic.
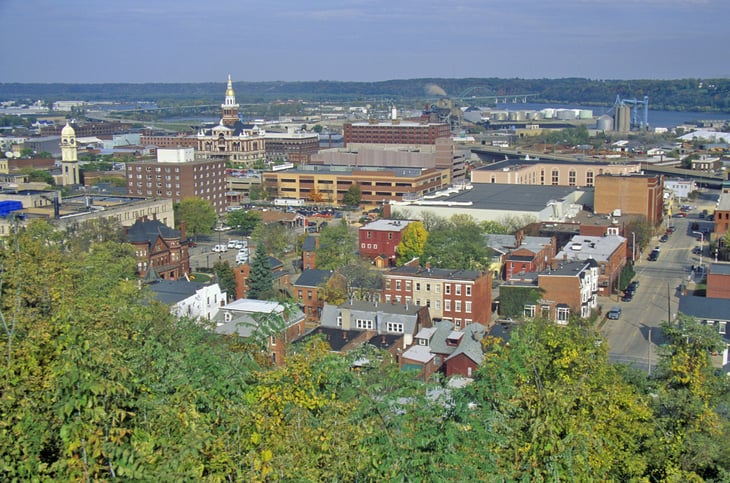
15. Tennessee
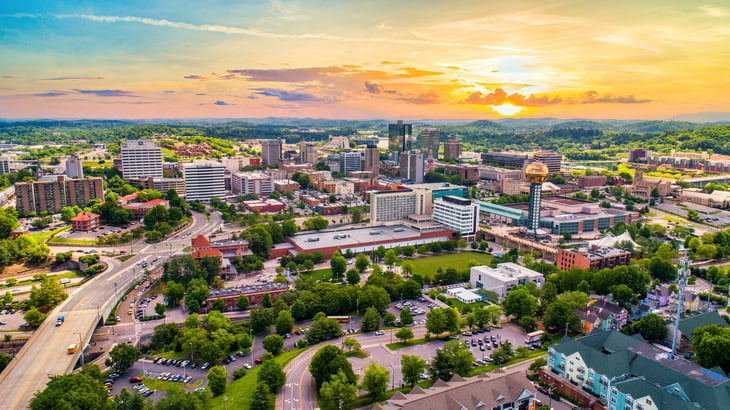
- Percentage change in used car spending (2019-2020): +15.4%
- Total change in used car spending (2019-2020): +$544,100,000
- Used car spending per capita (2020): $590
- Used car spending per capita (2019): $516
14. Alabama
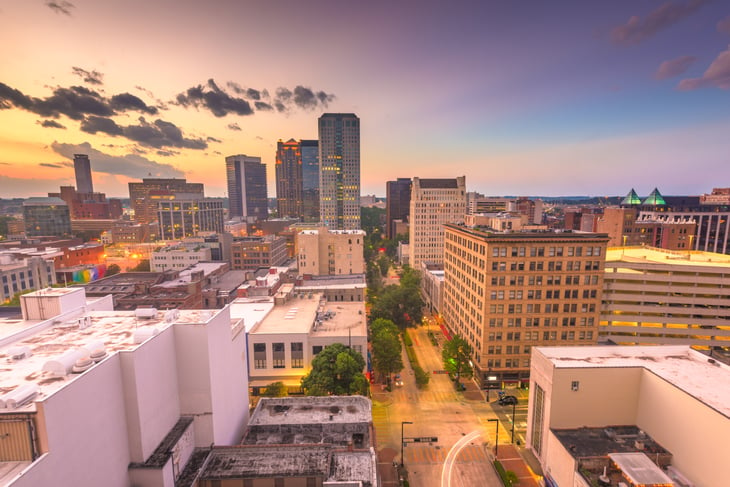
- Percentage change in used car spending (2019-2020): +15.5%
- Total change in used car spending (2019-2020): +$396,500,000
- Used car spending per capita (2020): $601
- Used car spending per capita (2019): $523
13. Alaska
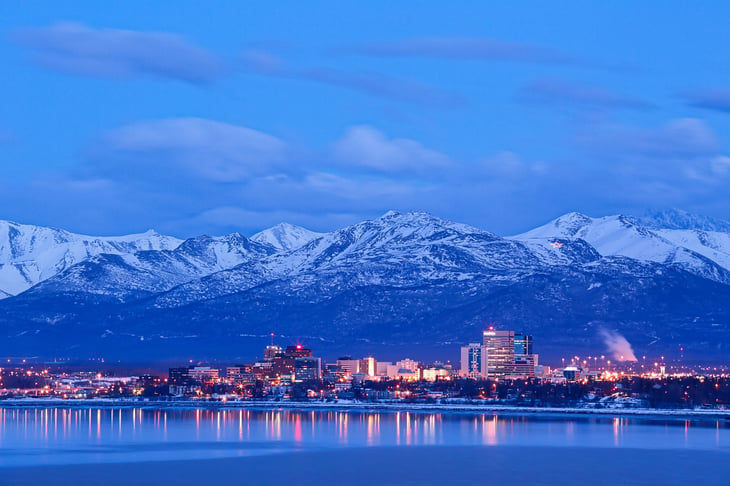
- Percentage change in used car spending (2019-2020): +15.7%
- Total change in used car spending (2019-2020): +$51,700,000
- Used car spending per capita (2020): $522
- Used car spending per capita (2019): $451

12. Mississippi
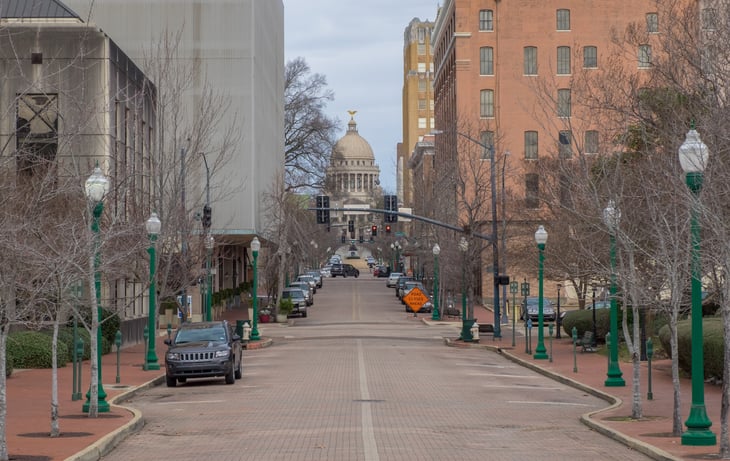
- Percentage change in used car spending (2019-2020): +16.3%
- Total change in used car spending (2019-2020): +$210,900,000
- Used car spending per capita (2020): $508
- Used car spending per capita (2019): $435
11. Oklahoma

- Percentage change in used car spending (2019-2020): +16.4%
- Total change in used car spending (2019-2020): +$398,400,000
- Used car spending per capita (2020): $711
- Used car spending per capita (2019): $615
10. South Dakota
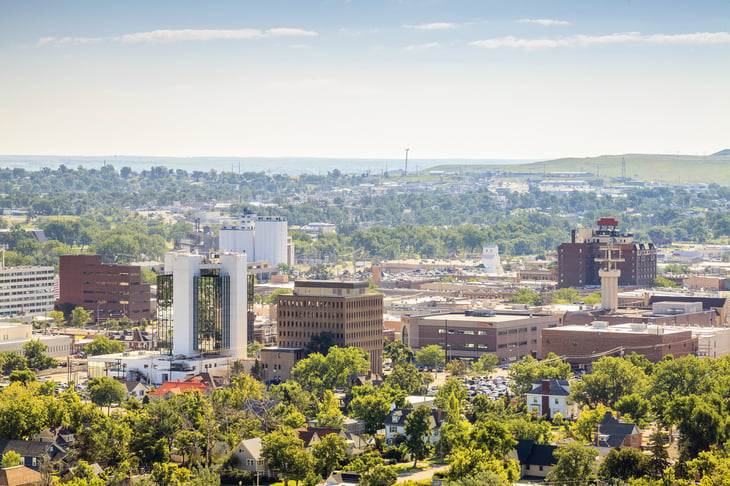
- Percentage change in used car spending (2019-2020): +17.2%
- Total change in used car spending (2019-2020): +$92,900,000
- Used car spending per capita (2020): $708
- Used car spending per capita (2019): $609
9. Maine
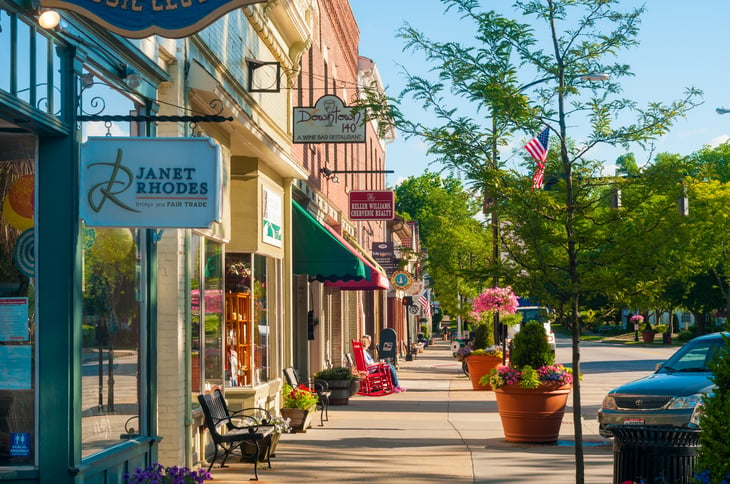
- Percentage change in used car spending (2019-2020): +17.5%
- Total change in used car spending (2019-2020): +$127,200,000
- Used car spending per capita (2020): $633
- Used car spending per capita (2019): $541
8. Wyoming
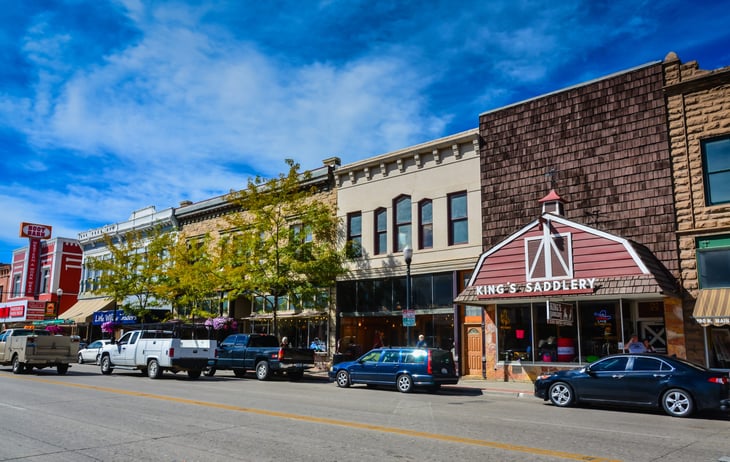
- Percentage change in used car spending (2019-2020): +18.3%
- Total change in used car spending (2019-2020): +$60,000,000
- Used car spending per capita (2020): $665
- Used car spending per capita (2019): $565
7. Nebraska
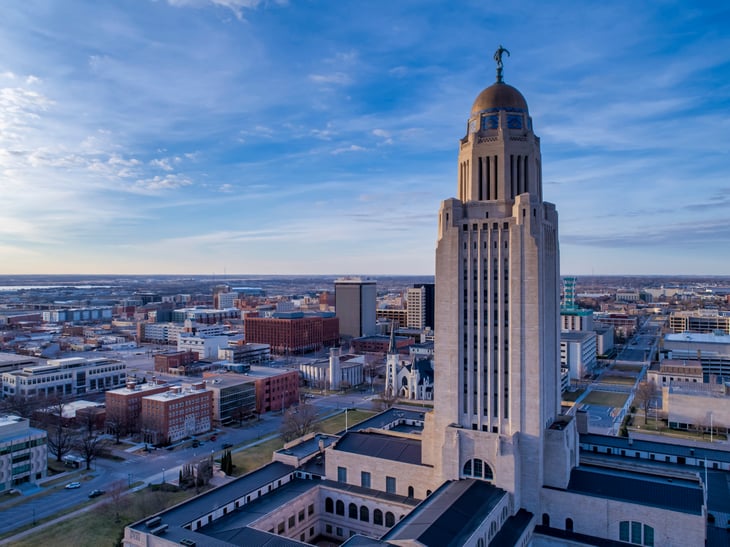
- Percentage change in used car spending (2019-2020): +18.4%
- Total change in used car spending (2019-2020): +$254,600,000
- Used car spending per capita (2020): $847
- Used car spending per capita (2019): $717
6. Iowa
- Percentage change in used car spending (2019-2020): +18.8%
- Total change in used car spending (2019-2020): +$445,600,000
- Used car spending per capita (2020): $892
- Used car spending per capita (2019): $753
5. South Carolina
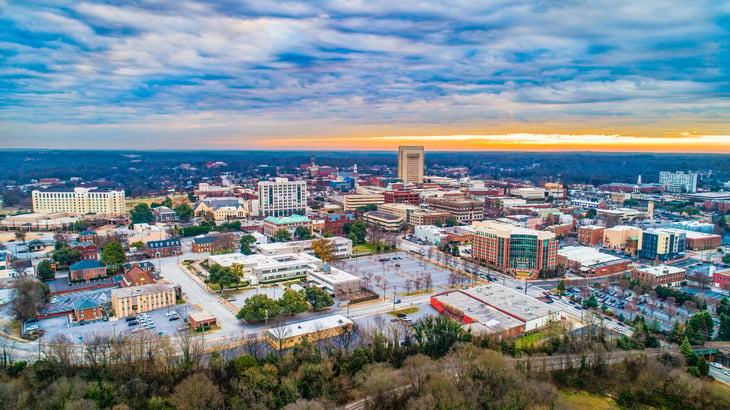
- Percentage change in used car spending (2019-2020): +19.1%
- Total change in used car spending (2019-2020): +$476,200,000
- Used car spending per capita (2020): $569
- Used car spending per capita (2019): $485
4. Montana
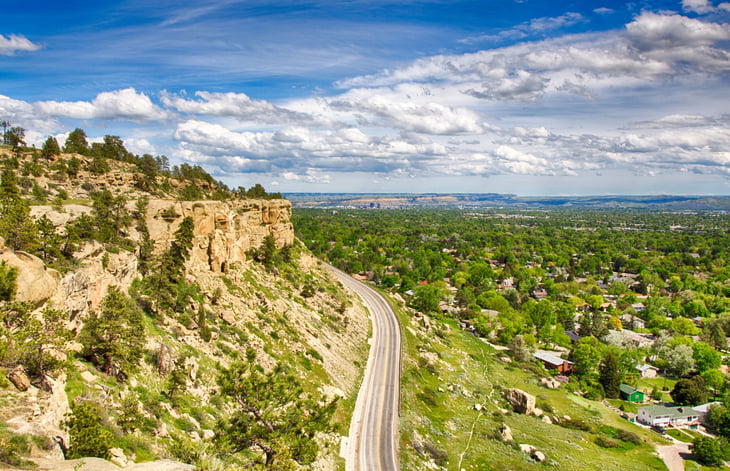
- Percentage change in used car spending (2019-2020): +19.3%
- Total change in used car spending (2019-2020): +$140,100,000
- Used car spending per capita (2020): $803
- Used car spending per capita (2019): $681
3. Idaho
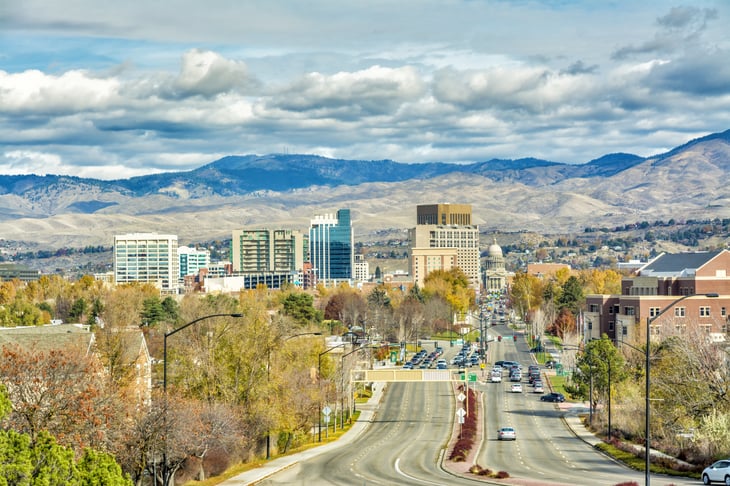
- Percentage change in used car spending (2019-2020): +19.6%
- Total change in used car spending (2019-2020): +$161,300,000
- Used car spending per capita (2020): $540
- Used car spending per capita (2019): $462
2. Utah
- Percentage change in used car spending (2019-2020): +20.6%
- Total change in used car spending (2019-2020): +$408,400,000
- Used car spending per capita (2020): $735
- Used car spending per capita (2019): $618
1. Arizona

- Percentage change in used car spending (2019-2020): +22.0%
- Total change in used car spending (2019-2020): +$719,200,000
- Used car spending per capita (2020): $537
- Used car spending per capita (2019): $448
Methodology

The data used in this analysis is from the U.S. Bureau of Economic Analysis’s Personal Consumption Expenditures. To determine the states with the biggest increase in used vehicle purchases during the COVID-19 pandemic, researchers calculated the percentage change in total used car spending from 2019 to 2020. In the event of a tie, the state with the greater total change in used car spending over the same time period was ranked higher.
Add a Comment
Our Policy: We welcome relevant and respectful comments in order to foster healthy and informative discussions. All other comments may be removed. Comments with links are automatically held for moderation.