


Editor's Note: This story originally appeared on HireAHelper.
The economy is showing many positive signs of recovery after two years of the COVID-19 pandemic, with unemployment falling and GDP growing rapidly. But despite some promising economic indicators, rising inflation remains the dominant story of today’s economy.
According to the Consumer Price Index, one of the most commonly cited measures of inflation, prices increased by 7.9% from February 2021 to February 2022 — the steepest increase in 40 years. February’s figures marked the tenth straight month with year-over-year price growth above 5%. In dollars, U.S. households are paying an average of $435 per month more for their expenses now than at the beginning of 2021.
And as rising prices put more pressure on household finances, people have been forced to turn to alternatives to pay for their expenses. According to recently collected data from the Census Bureau’s Household Pulse Survey, more than 73 million Americans—around one-third of all adults—reported having used credit cards or loans to cover regular expenses in the week prior to the survey, while 53 million have tapped into savings and nearly 28 million have borrowed.
Some of these alternatives come with costs of their own, as payments toward interest for credit cards, loans, and borrowing can add even more expense to household budgets.
The data used in this analysis is from the U.S. Census Bureau’s Household Pulse Survey collected at the beginning of February 2022. To determine the states whose residents are struggling the most financially, researchers at HireAHelper created a composite index based on the following metrics:
- Adults who faced difficulty paying for usual expenses
- Adults who faced food insufficiency
- Adults who faced loss of income
- Households behind on housing payments
Here are the states whose residents are struggling the most financially.
15. New York

- Composite index: 66.83
- Adults who faced difficulty paying for usual expenses: 58.6%
- Adults who faced food insufficiency: 34.6%
- Adults who faced loss of income: 19.4%
- Households behind on housing payments: 19.7%
14. Florida
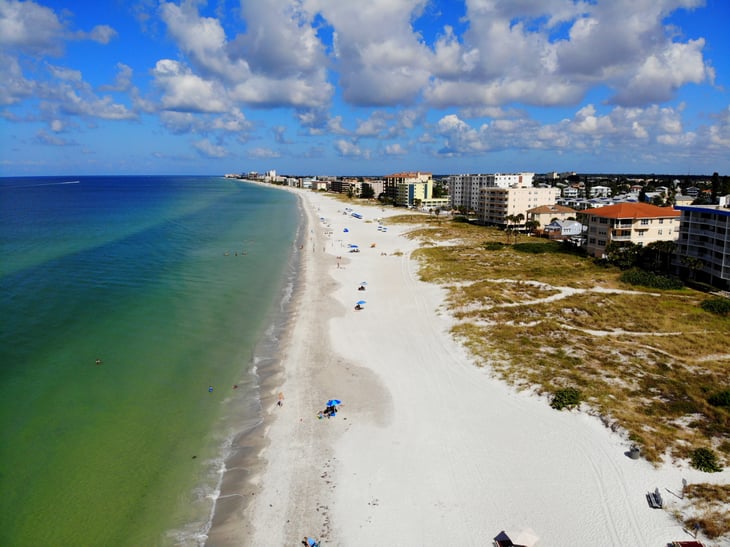
- Composite index: 71.45
- Adults who faced difficulty paying for usual expenses: 60.5%
- Adults who faced food insufficiency: 40.4%
- Adults who faced loss of income: 18.3%
- Households behind on housing payments: 11.3%

13. Hawaii

- Composite index: 73.48
- Adults who faced difficulty paying for usual expenses: 57.0%
- Adults who faced food insufficiency: 39.8%
- Adults who faced loss of income: 18.9%
- Households behind on housing payments: 18.1%
12. West Virginia

- Composite index: 76.55
- Adults who faced difficulty paying for usual expenses: 64.9%
- Adults who faced food insufficiency: 41.4%
- Adults who faced loss of income: 16.2%
- Households behind on housing payments: 15.5%
11. California
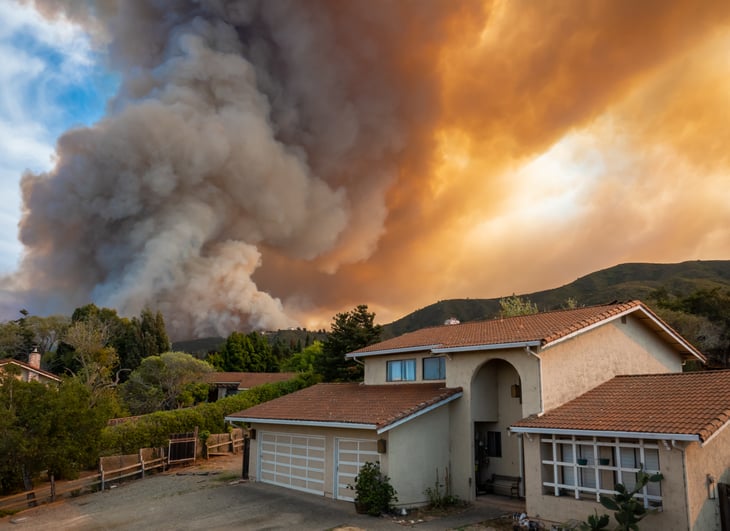
- Composite index: 77.05
- Adults who faced difficulty paying for usual expenses: 59.9%
- Adults who faced food insufficiency: 35.9%
- Adults who faced loss of income: 23.4%
- Households behind on housing payments: 12.3%
10. Alabama

- Composite index: 77.55
- Adults who faced difficulty paying for usual expenses: 64.0%
- Adults who faced food insufficiency: 45.2%
- Adults who faced loss of income: 19.9%
- Households behind on housing payments: 10.2%
9. Texas

- Composite index: 80.10
- Adults who faced difficulty paying for usual expenses: 64.2%
- Adults who faced food insufficiency: 41.5%
- Adults who faced loss of income: 21.3%
- Households behind on housing payments: 10.2%
8. South Carolina

- Composite index: 81.10
- Adults who faced difficulty paying for usual expenses: 60.8%
- Adults who faced food insufficiency: 42.2%
- Adults who faced loss of income: 19.9%
- Households behind on housing payments: 12.6%
7. Louisiana

- Composite index: 82.65
- Adults who faced difficulty paying for usual expenses: 62.4%
- Adults who faced food insufficiency: 36.4%
- Adults who faced loss of income: 22.7%
- Households behind on housing payments: 15.1%
6. New Jersey
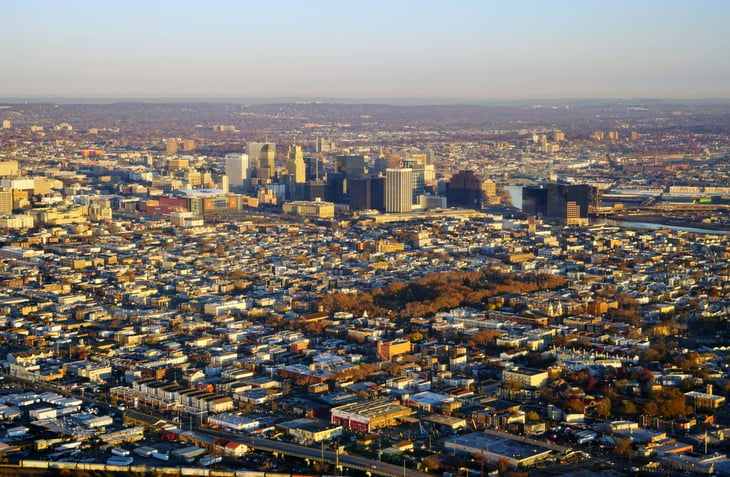
- Composite index: 84.20
- Adults who faced difficulty paying for usual expenses: 63.5%
- Adults who faced food insufficiency: 37.8%
- Adults who faced loss of income: 21.2%
- Households behind on housing payments: 17.1%
5. Oklahoma

- Composite index: 85.20
- Adults who faced difficulty paying for usual expenses: 61.4%
- Adults who faced food insufficiency: 39.0%
- Adults who faced loss of income: 22.4%
- Households behind on housing payments: 14.4%
4. New Mexico

- Composite index: 86.23
- Adults who faced difficulty paying for usual expenses: 65.7%
- Adults who faced food insufficiency: 41.1%
- Adults who faced loss of income: 21.8%
- Households behind on housing payments: 11.8%
3. Arkansas

- Composite index: 86.75
- Adults who faced difficulty paying for usual expenses: 66.8%
- Adults who faced food insufficiency: 50.0%
- Adults who faced loss of income: 20.2%
- Households behind on housing payments: 11.3%
2. Nevada

- Composite index: 88.80
- Adults who faced difficulty paying for usual expenses: 62.0%
- Adults who faced food insufficiency: 44.4%
- Adults who faced loss of income: 25.1%
- Households behind on housing payments: 12.0%
1. Mississippi
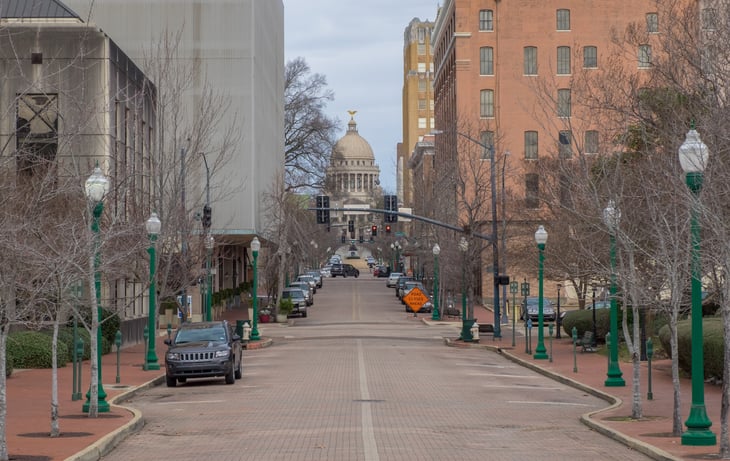
- Composite index: 94.90
- Adults who faced difficulty paying for usual expenses: 70.9%
- Adults who faced food insufficiency: 49.9%
- Adults who faced loss of income: 20.7%
- Households behind on housing payments: 20.6%
Methodology

The data used in this analysis is from the U.S. Census Bureau’s Household Pulse Survey collected at the beginning of February 2022. To determine the states whose residents are struggling the most financially, researchers created a composite index based on the following metrics:
- Adults who faced difficulty paying for usual expenses
- Adults who faced food insufficiency
- Adults who faced loss of income
- Households behind on housing payments
Add a Comment
Our Policy: We welcome relevant and respectful comments in order to foster healthy and informative discussions. All other comments may be removed. Comments with links are automatically held for moderation.