


Editor's Note: This story originally appeared on CoPilot.
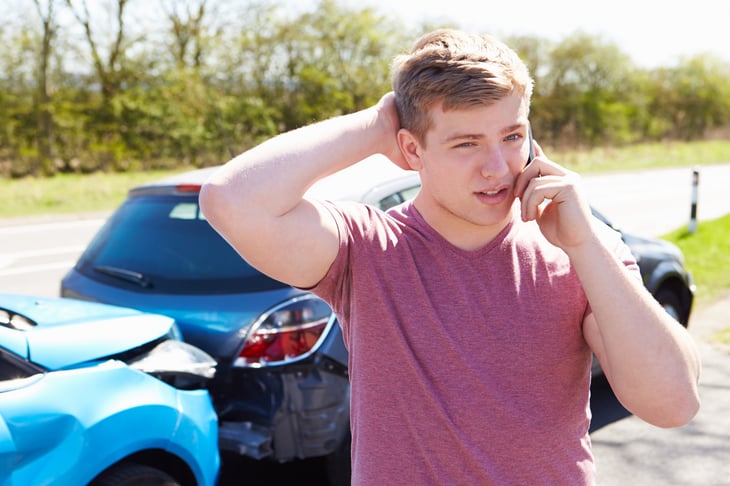
Learning to drive is a major rite of passage for most teenagers, but doing so also comes with a fair amount of risk. In addition to simply being inexperienced on the road, teen drivers are more irresponsible in their decisions, more prone to distraction, and more likely to make errors behind the wheel.
In practice, all of these factors raise the likelihood that teenagers will speed, drive recklessly, and end up in accidents. Some safeguards are in place to help limit these risks. For instance, more states have recently implemented graduated licensing processes where teens get more driving privileges with more experience on the road, and insurers charge significantly higher rates to cover young drivers because the chances that something will go wrong are much higher.
But despite these efforts, teens are the riskiest group on the road. According to the CDC, the risk of a fatal crash is three times higher per mile driven for drivers aged 16 to 19 than for drivers aged 20 and up. Risks are particularly high for male drivers, drivers with other teenage passengers, and teens who are in the first few months after receiving their license.
There have been some encouraging signs that teen driver fatalities are on the decline. In 2005, the total number of teens killed in motor vehicles was 5,300; by 2019, that number had been cut by more than half, to 2,375. Much of this improvement is attributable to public policy reforms incorporated into the licensing process, like bans on cellphone use, restrictions on driving at night, or limits on the number of passengers who can be in a vehicle with a teen behind the wheel.
Males More Likely to Speed, Females More Likely to Drive Distracted
Interestingly, while the number of teens killed overall has declined between 2005 and 2019, the respective share of fatalities by gender has remained fairly steady over time, with male teen drivers accounting for between 63% and 69% of vehicle deaths every year during that span. This suggests that male and female teen drivers exhibit consistently differently driving behaviors—and that teen males’ driving behaviors are riskier.
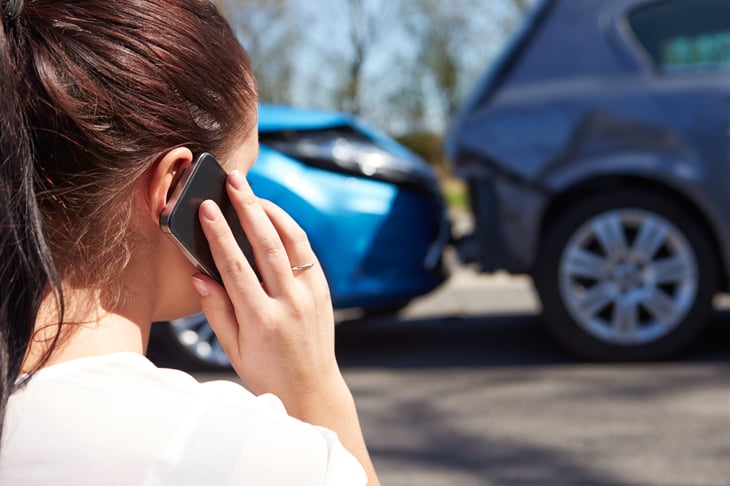
That said, the data also shows that female teen drivers are more likely to engage in distracted driving. According to the National Highway Traffic Safety Association, distracted driving includes texting or talking on the phone, eating and drinking, talking to other passengers, and any other activity that diverts attention from the road. Such behaviors are associated far more with fatal accidents involving female teen drivers, who are on average at least 70% more likely to be distracted compared with their male peers.
For teen males, in contrast, the main difference is speeding. Male teen drivers are about 20% more likely, on average, to be speeding in a fatal accident. Speeding accounts for the largest share of teen driver fatalities each year, so young males’ greater tendency to speed is one of the reasons why they are consistently involved in more fatal accidents than their female counterparts each year.
States With the Riskiest Teen Drivers
The riskiness of teen drivers can look different according to geographic location too. Every state has different laws for licensing and traffic safety, and there is also variation in the total number of fatalities based on states’ population and total vehicle miles traveled in a given year. But many of the behaviors that lead to fatal accidents involving teens occur at different rates in different locations.
To identify the locations with the teenage drivers who engage in the riskiest behavior, researchers at CoPilot developed a composite measure using data from the CDC’s Youth Risk Behavior Surveillance System (YRBSS). The composite index considers the share of young people self-reporting three high-risk driving behaviors: not wearing a seatbelt, drinking and driving, and texting and driving. At the national level, 6.5% of students surveyed reported not regularly wearing a seatbelt, 5.4% reported drinking and driving, and a staggering 39.0% reported texting and driving.
Keep reading to see the 15 states with the riskiest teenage drivers.
15. Iowa

- Composite risk index: 52.7
- Percentage of students who don’t wear a seatbelt: 6.3%
- Percentage of students who drink and drive: 4.9%
- Percentage of students who text and drive: 48.7%

14. Colorado

- Composite risk index: 53.7
- Percentage of students who don’t wear a seatbelt: 4.9%
- Percentage of students who drink and drive: 5.4%
- Percentage of students who text and drive: 51.3%
13. Florida
- Composite risk index: 54.1
- Percentage of students who don’t wear a seatbelt: 7.9%
- Percentage of students who drink and drive: 5.6%
- Percentage of students who text and drive: 35.6%
12. Missouri

- Composite risk index: 56.6
- Percentage of students who don’t wear a seatbelt: 8.5%
- Percentage of students who drink and drive: 4.2%
- Percentage of students who text and drive: 45.8%
11. North Dakota

- Composite risk index: 61.9
- Percentage of students who don’t wear a seatbelt: 5.9%
- Percentage of students who drink and drive: 5.5%
- Percentage of students who text and drive: 53.0%
10. Arizona
- Composite risk index: 63.0
- Percentage of students who don’t wear a seatbelt: 8.6%
- Percentage of students who drink and drive: 5.4%
- Percentage of students who text and drive: 41.4%
9. California

- Composite risk index: 63.1
- Percentage of students who don’t wear a seatbelt: 14.8%
- Percentage of students who drink and drive: 5.7%
- Percentage of students who text and drive: 30.8%
8. Alabama

- Composite risk index: 63.8
- Percentage of students who don’t wear a seatbelt: 9.6%
- Percentage of students who drink and drive: 4.8%
- Percentage of students who text and drive: 44.4%
7. Mississippi

- Composite risk index: 68.4
- Percentage of students who don’t wear a seatbelt: 9.9%
- Percentage of students who drink and drive: 5.3%
- Percentage of students who text and drive: 43.9%
6. Nebraska

- Composite risk index: 73.3
- Percentage of students who don’t wear a seatbelt: 7.4%
- Percentage of students who drink and drive: 5.8%
- Percentage of students who text and drive: 50.7%
5. Kansas
- Composite risk index: 76.6
- Percentage of students who don’t wear a seatbelt: 6.9%
- Percentage of students who drink and drive: 7.7%
- Percentage of students who text and drive: 51.2%
4. Montana

- Composite risk index: 83.0
- Percentage of students who don’t wear a seatbelt: 7.5%
- Percentage of students who drink and drive: 7.1%
- Percentage of students who text and drive: 53.3%
3. Louisiana

- Composite risk index: 83.6
- Percentage of students who don’t wear a seatbelt: 14.6%
- Percentage of students who drink and drive: 9.6%
- Percentage of students who text and drive: 42.6%

2. Arkansas

- Composite risk index: 85.1
- Percentage of students who don’t wear a seatbelt: 11.5%
- Percentage of students who drink and drive: 6.7%
- Percentage of students who text and drive: 46.2%
1. South Dakota

- Composite risk index: 89.4
- Percentage of students who don’t wear a seatbelt: 11.7%
- Percentage of students who drink and drive: 6.3%
- Percentage of students who text and drive: 50.5%
Detailed Findings & Methodology
The primary ranking data used in this analysis is from the U.S. Centers for Disease Control and Prevention’s Youth Risk Behavior Surveillance System (YRBSS), which is a representative survey of ninth- through 12th-grade students in public and private schools in the United States. The chart data is from the U.S. National Highway Traffic Safety Administration’s Fatality Analysis Reporting System (FARS).
To determine the states with the riskiest teenage drivers, researchers created a composite index based on the following YRBSS metrics, all weighted equally:
- Percentage of students who don’t wear a seatbelt: the percentage of teens who rarely or never wore a seat belt (when riding in a car driven by someone else)
- Percentage of students who drink and drive: the percentage of teens who drove when they had been drinking alcohol (in a car or other vehicle, one or more times during the 30 days before the survey, among students who had driven a car or other vehicle during the 30 days before the survey)
- Percentage of students who text and drive: the percentage of teens who texted or emailed while driving a car or other vehicle (on at least one day during the 30 days before the survey, among students who had driven a car or other vehicle during the 30 days before the survey)
Only states with complete data available for all three factors were included in the analysis.
Add a Comment
Our Policy: We welcome relevant and respectful comments in order to foster healthy and informative discussions. All other comments may be removed. Comments with links are automatically held for moderation.