


Editor's Note: This story originally appeared on Construction Coverage.
Roadways are a vital component of infrastructure in the United States.
However, many highways, major roads, and bridges are in need of repair. Hazardous road conditions can negatively impact the economy, contribute to traffic congestion, and impact the safety of Americans.
The passing of the Infrastructure Investment and Jobs Act (also referred to as the Bipartisan Infrastructure Package) highlights the importance of reliable roads in the U.S. and the commitment to improving America’s infrastructure.
There’s no shortage of roads that need fixing, and total highway expenditures have grown over the past 20 years, highlighting the government’s commitment to improving America’s most common form of transportation.
To determine the states with the worst roads, researchers at Construction Coverage calculated the share of major roadways in poor condition. The data used in this analysis is from the U.S. Department of Transportation Federal Highway Administration.
Major roadways are defined to include interstates, other freeways and expressways, other principal arterials, and minor arterials. Find our detailed methodology at the end.
Here are the states with the worst roads.
15. Pennsylvania
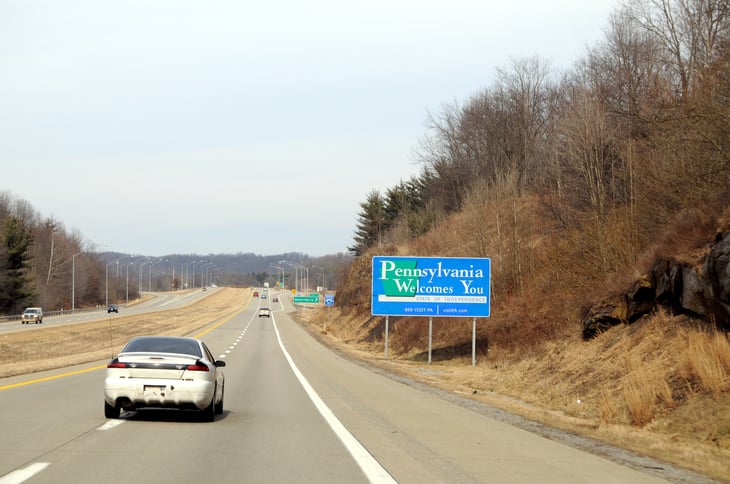
- Share of major roadways in poor condition: 16.8%
- Share of major roadways in fair condition: 39.9%
- Share of major roadways in good condition: 43.3%
- Daily vehicle-miles traveled per capita: 18.8
14. Colorado
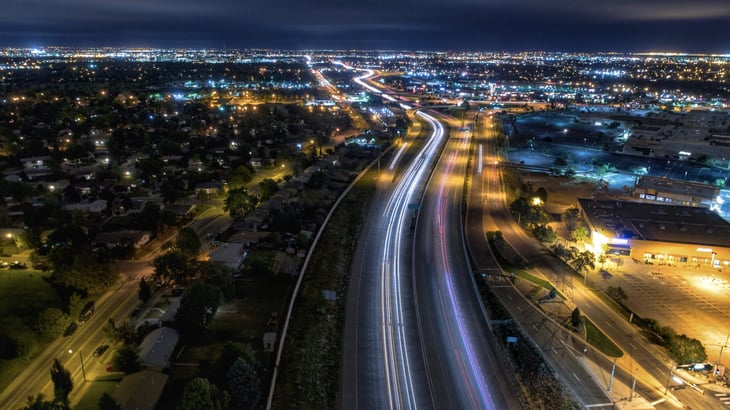
- Share of major roadways in poor condition: 17.5%
- Share of major roadways in fair condition: 41.0%
- Share of major roadways in good condition: 41.5%
- Daily vehicle-miles traveled per capita: 23.4
13. Louisiana
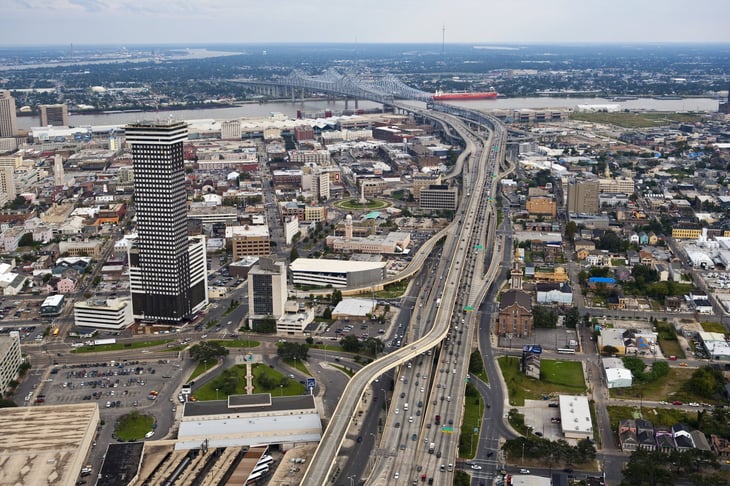
- Share of major roadways in poor condition: 17.6%
- Share of major roadways in fair condition: 41.9%
- Share of major roadways in good condition: 40.4%
- Daily vehicle-miles traveled per capita: 28.4

12. Michigan
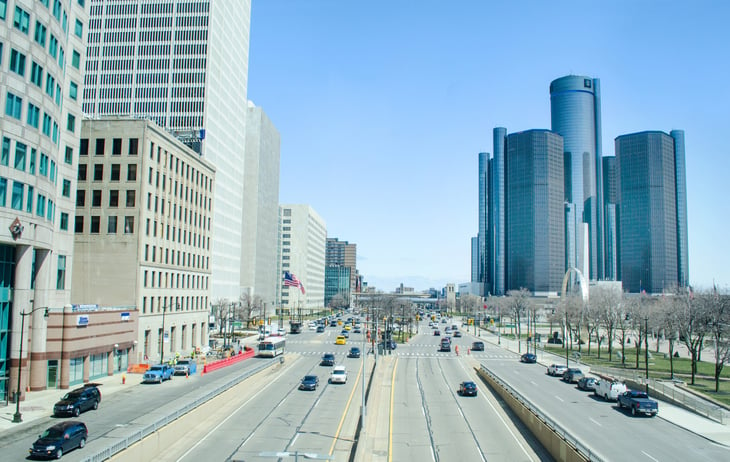
- Share of major roadways in poor condition: 18.4%
- Share of major roadways in fair condition: 30.6%
- Share of major roadways in good condition: 51.0%
- Daily vehicle-miles traveled per capita: 23.8
11. New Mexico
- Share of major roadways in poor condition: 19.6%
- Share of major roadways in fair condition: 30.6%
- Share of major roadways in good condition: 49.9%
- Daily vehicle-miles traveled per capita: 31.0
10. Washington
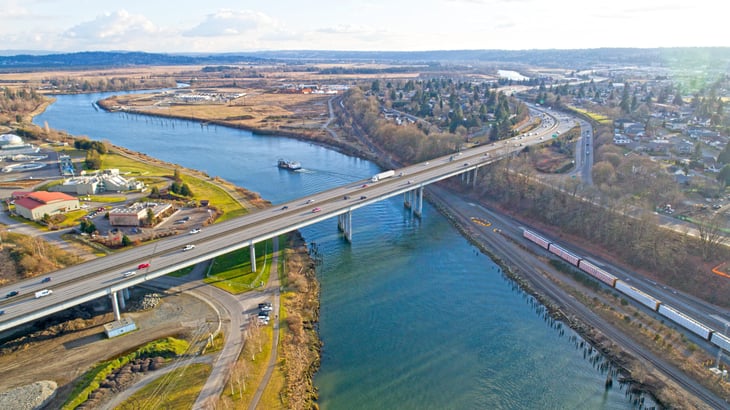
- Share of major roadways in poor condition: 19.6%
- Share of major roadways in fair condition: 40.6%
- Share of major roadways in good condition: 39.8%
- Daily vehicle-miles traveled per capita: 19.6
9. Maryland
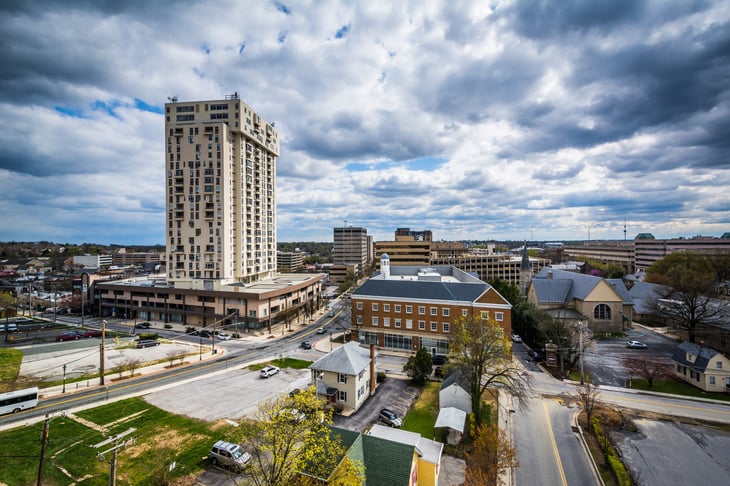
- Share of major roadways in poor condition: 20.5%
- Share of major roadways in fair condition: 29.1%
- Share of major roadways in good condition: 50.4%
- Daily vehicle-miles traveled per capita: 23.1
8. Wisconsin
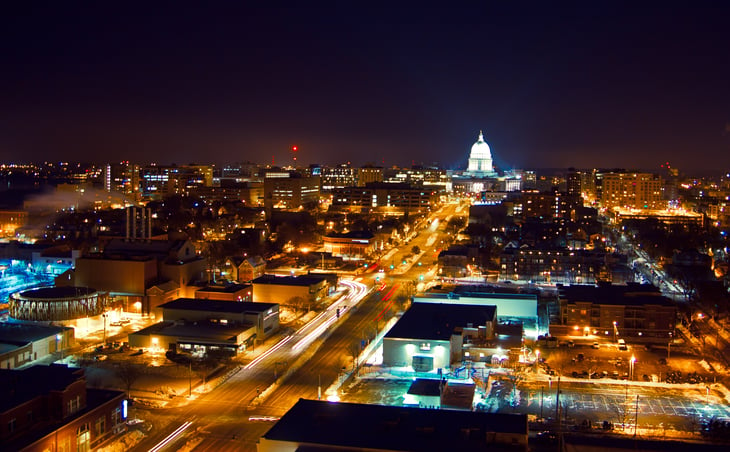
- Share of major roadways in poor condition: 22.1%
- Share of major roadways in fair condition: 37.6%
- Share of major roadways in good condition: 40.2%
- Daily vehicle-miles traveled per capita: 27.2
7. Connecticut
- Share of major roadways in poor condition: 23.7%
- Share of major roadways in fair condition: 43.3%
- Share of major roadways in good condition: 33.1%
- Daily vehicle-miles traveled per capita: 22.9
6. New York
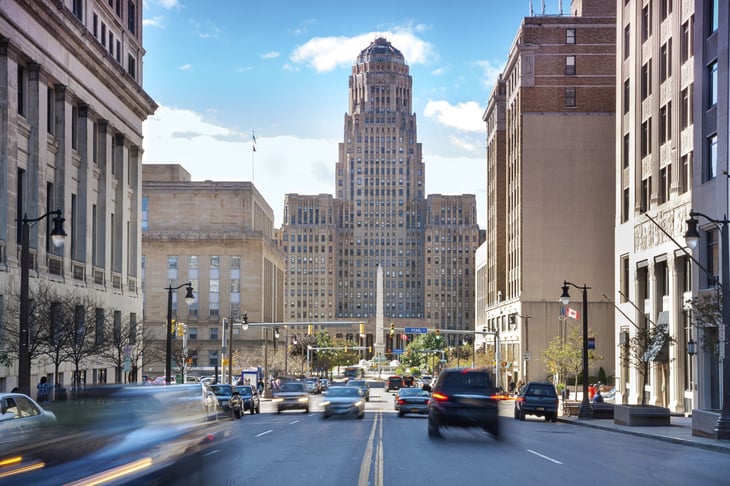
- Share of major roadways in poor condition: 24.0%
- Share of major roadways in fair condition: 36.7%
- Share of major roadways in good condition: 39.3%
- Daily vehicle-miles traveled per capita: 14.4
5. Hawaii
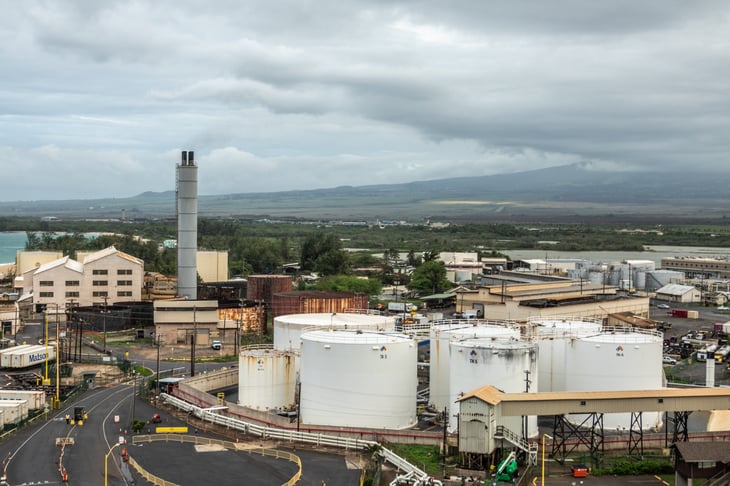
- Share of major roadways in poor condition: 26.1%
- Share of major roadways in fair condition: 44.7%
- Share of major roadways in good condition: 29.0%
- Daily vehicle-miles traveled per capita: 16.9
4. Massachusetts
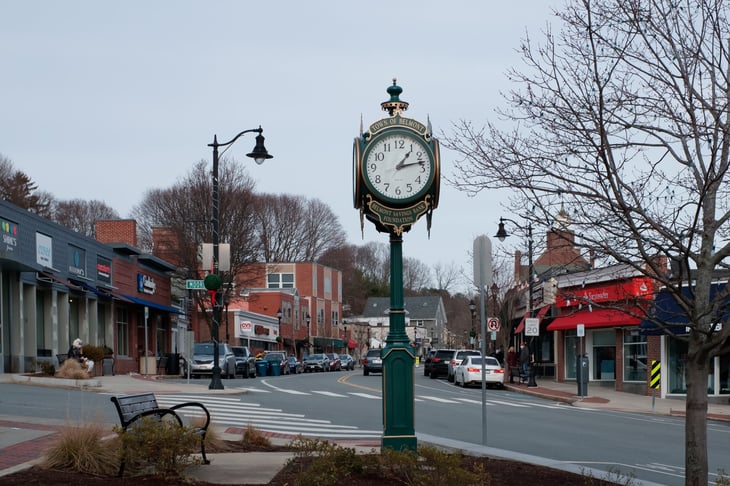
- Share of major roadways in poor condition: 29.5%
- Share of major roadways in fair condition: 35.9%
- Share of major roadways in good condition: 34.6%
- Daily vehicle-miles traveled per capita: 21.6
3. California
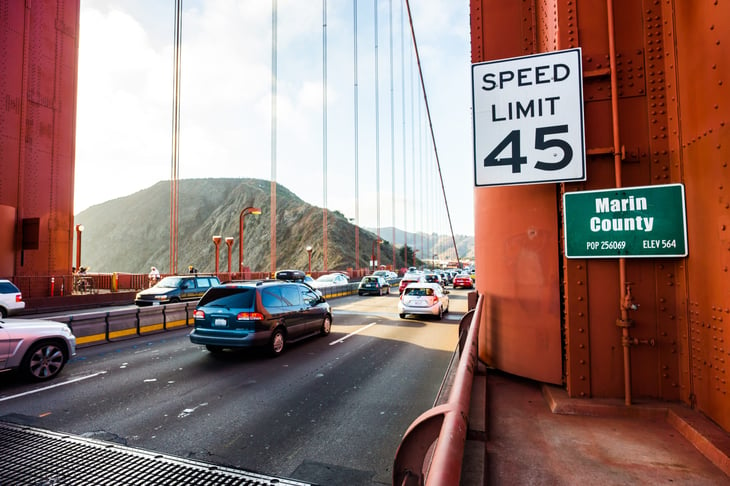
- Share of major roadways in poor condition: 30.8%
- Share of major roadways in fair condition: 32.9%
- Share of major roadways in good condition: 36.3%
- Daily vehicle-miles traveled per capita: 20.9
2. New Jersey
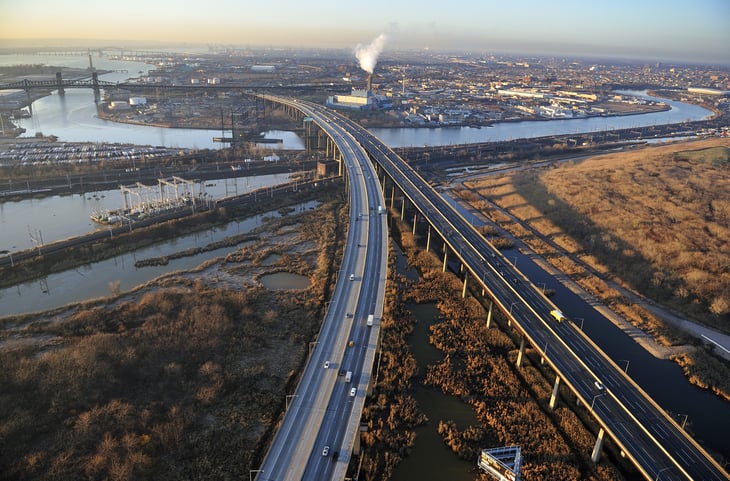
- Share of major roadways in poor condition: 36.4%
- Share of major roadways in fair condition: 31.1%
- Share of major roadways in good condition: 32.5%
- Daily vehicle-miles traveled per capita: 20.5
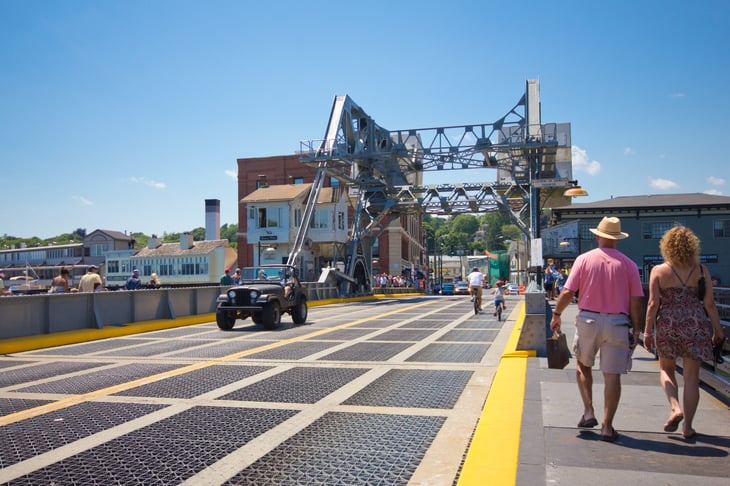
1. Rhode Island
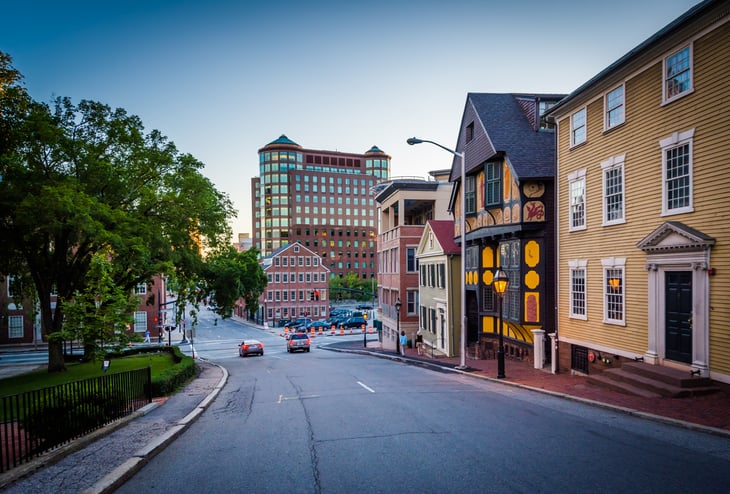
- Share of major roadways in poor condition: 38.8%
- Share of major roadways in fair condition: 37.1%
- Share of major roadways in good condition: 24.0%
- Daily vehicle-miles traveled per capita: 17.8
Methodology

The data used in this analysis is from the U.S. Department of Transportation Federal Highway Administration’s Highway Statistics Series.
To determine the states with the worst roads, researchers at Construction Coverage calculated the percentage of major roadways in poor condition using the latest data available. In the event of a tie, the state with the lower share of major roadways in good condition was ranked higher.
Major roadways are defined to include interstates, other freeways and expressways, other principal arterials, and minor arterials.
The International Roughness Index (IRI) was used to classify poor, fair, and good conditions of roadways by the following criteria:
- Poor: IRI greater than 170 inches/mile
- Fair: IRI between 95 and 170 inches/mile
- Good: IRI less than 95 inches/mile
Add a Comment
Our Policy: We welcome relevant and respectful comments in order to foster healthy and informative discussions. All other comments may be removed. Comments with links are automatically held for moderation.