


Editor's Note: This story originally appeared on SmartAsset.com.
Buying a home is an important financial milestone. Many homebuyers have to save up for years, even decades, to buy their dream home. For them, this is a long-term investment that can also help them build home equity with each mortgage payment. This is why it’s ideal to buy in a housing market where the value of their property can grow steadily over time. To this end, SmartAsset analyzed data from metropolitan areas nationwide to identify and rank the top and bottom markets for growth and stability in 2021.
To find out which housing markets are best for growth and stability, SmartAsset compared home value data in 358 metropolitan areas across the U.S. We looked at statistics from every quarter from Q1 of 1996 through Q4 of 2020. For details on our data sources and how we put all the information together to create our final rankings, check out the Data and Methodology section at the end.
This is SmartAsset’s seventh look at the best housing markets for growth and stability. Read the 2020 version of the study here.
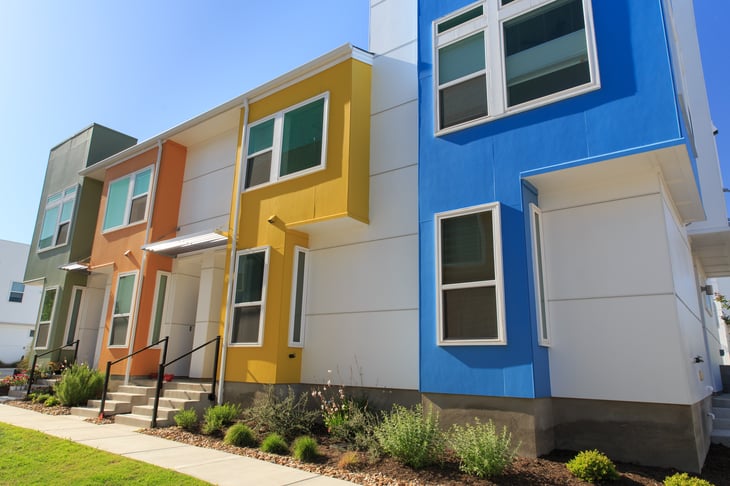
Top 5 Housing Markets for Growth and Stability

When it comes to growth and stability, there are three Texas metro areas in the top five along with two other communities in the West.
1. Midland, TX

For the second year in a row, Midland, Texas, is the top U.S. metro area for growth and stability in the housing market. Home prices increased nearly 257% from 1996 through the end of 2020 — 10th-best among all 358 metro areas in our study. Meanwhile, there was a 0% chance that a home would suffer a 5% drop in price within 10 years of being purchased.
2. Austin-Round Rock-Georgetown, TX
Greater Austin, Texas, is also recognized as one of the top growing and stable housing markets in the country. The Austin-Round Rock-Georgetown metro area saw home prices rise nearly 256% between 1996 and 2020, ranking 11th-highest for growth in our study. The housing market was also consistently stable, with a 0% chance of a 5% drop in home price during the time period of our study.
3. Boulder, CO

Boulder, Colorado, claims the No. 3 spot in our rankings for the second year in a row. Situated in the foothills of the Rocky Mountains, the Boulder area saw home prices climb 238% between 1996 and 2020, the 17th-highest growth rate in our study. The odds of a 5% price drop in Boulder within 10 years of a home’s purchase were just 1%.
4. Odessa, TX

Located in West Texas, Odessa had the 20th-highest home price growth rate (nearly 227%) of all 358 metro areas in our study. Despite a 5% chance that a home would suffer a 5% drop in value between 1996 and 2020, Odessa cracks our top five this year after ranking eighth in last year’s study.
5. San Jose-Sunnyvale-Santa Clara, CA
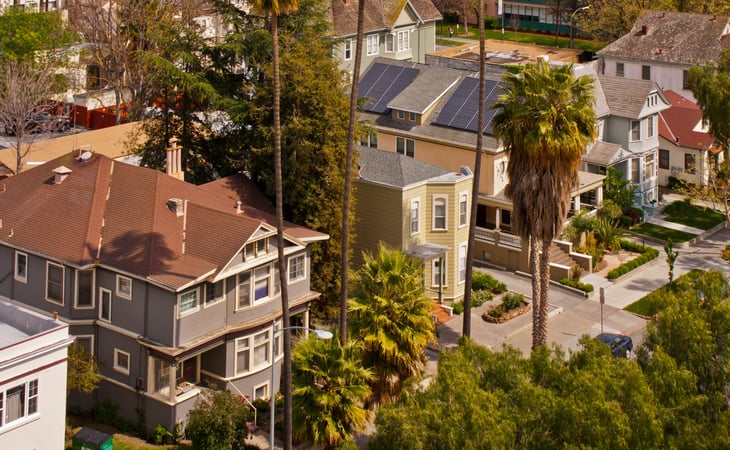
Of the top 20 cities in our study, the San Jose, California, metro area had the second-highest probability (19%) that a home would lose 5% of its value within 10 years of being purchased. However, the metro Bay Area experienced a price boom over the last 25 years, as home prices soared 309%, the second-highest growth rate in our study.
Bottom 5 Housing Markets for Growth and Stability

Michigan, on the other hand, is home to four metro areas ranked in the bottom five.

1. Flint, MI

Located between Saginaw and Detroit, the Flint metro area is last in combined stability and growth. The chance that a home price would drop 5% within 10 years of being purchased was 45%, the highest rate for this metric in the study. Meanwhile, home prices rose by just under 71% in the last 25 years – ranking only 329th out of 358.
2. Rockford, IL

Home prices in Rockford, Illinois, rose at the slowest rate of any metro area in the study – just 42%. Meanwhile, homebuyers ran a 38% chance that their properties would lose at least 5% of their value within 10 years of purchase.
3. Monroe, MI

Like the Detroit metro area, there was a 44% probability in Monroe, Michigan, that a home would see its price drop 5% within 10 years of being purchased. Price growth also lagged behind most metro areas on our list, increasing only about 81% in the last 25 years.
4. Saginaw, MI

One hundred miles northwest of Detroit, the Saginaw, Michigan, metro area saw home prices rise only 58% in the last 25 years, which is among the lowest growth rates in our study. Saginaw was also particularly unstable during that time period. There was a 40% chance a home would drop at least 5% in value within 10 years after being purchased.
5. Detroit-Dearborn-Livonia, MI
If you bought a home in the Detroit metro area between 1996 and 2020, there was a 44% chance the home would have lost at least 5% of its value within 10 years of its purchase. That’s tied for the second-lowest stability score on our list. Home prices, meanwhile, rose just 84% in that timespan, 302nd out of the 358 metro areas studied.
Data and Methodology

To compile our rankings of the best and worst housing markets for growth and stability, we looked at data for 358 metro areas and specifically compared them across these two metrics:
- Stability. This is the probability that homeowners experienced a significant price decline (5% or more) at any point in the 10 years after they purchased the home.
- Overall home price growth. The total growth in home prices during the time period we analyzed.
All data comes from the Federal Housing Administration (FHA). It covers the 25-year period from the first quarter of 1996 through the fourth quarter of 2020.
We used these two metrics to create our final rankings. Areas received a score of 100 on the stability metric if there was a 0% chance of a significant price decline. The metro area with the highest chance of a significant price decline (45%) received a score of 0. We scored all other metro areas based on where they fell between these two values. The metro area with the highest overall home price growth received a growth index score of 100 and the metro area with the lowest growth received a 0. We scored all other metro areas based on their growth percentage between these two values. Lastly, we averaged each metro area’s scores over the two metrics. The metro area with the highest average score ranked first.
Add a Comment
Our Policy: We welcome relevant and respectful comments in order to foster healthy and informative discussions. All other comments may be removed. Comments with links are automatically held for moderation.