


Editor's Note: This story originally appeared on Smartest Dollar.
While needs for analytical workers have grown throughout the economy, demand for critical-thinking skills has been especially high in certain fields.
Roles in business operations and management have shown the highest rate of growth over the last decade.
These fast-growing analytical occupations include market research analysts, financial examiners, and human resources managers, all of which saw total employment more than double from 2011 to 2021.
Meanwhile, the occupation general and operations managers saw total employment grow by more than 1 million workers over the same span, becoming the second-largest analytical occupation.
Geographically, demand for workers in analytical occupations depends on factors specific to state and local economies.
Most metros with higher-than-average concentrations of analytical workers are cities with highly educated workforces and economies based in industries heavy in analytical needs like tech, financial services, law, and other big business.
To determine the locations with the most analytical workers, researchers at Smartest Dollar calculated the percentage of all workers in analytical occupations — or occupations that rank in the top 50% for O*NET’s Critical Thinking index. The data used in this analysis is from the U.S. Bureau of Labor Statistics as well as O*NET Online.
In the event of a tie, the location with the greater total workers in analytical occupations was ranked higher. Here are the U.S. metropolitan areas with the most analytical workers.
15. Raleigh, NC

- Percentage of all workers in analytical occupations: 35.5%
- Concentration of workers in analytical occupations (compared with average): +5.0%
- Total workers in analytical occupations: 225,080
- Total workers in non-analytical occupations: 408,180
14. New York-Newark-Jersey City, NY-NJ-PA

- Percentage of all workers in analytical occupations: 35.6%
- Concentration of workers in analytical occupations (compared with average): +5.3%
- Total workers in analytical occupations: 3,088,070
- Total workers in non-analytical occupations: 5,590,040
13. Sacramento–Roseville–Arden-Arcade, CA
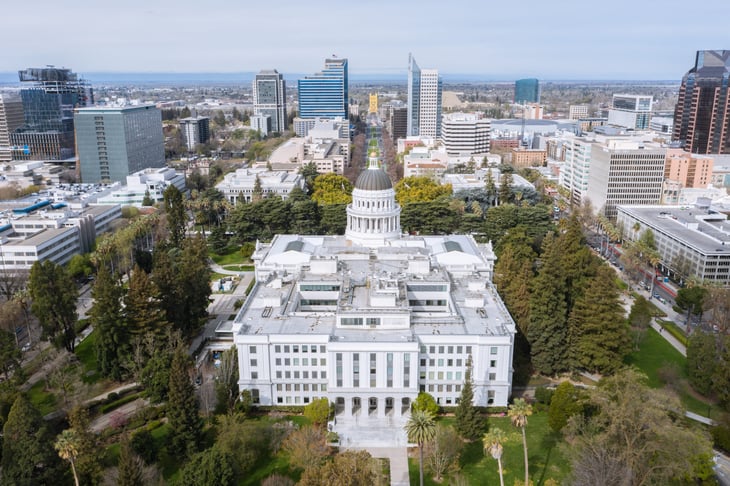
- Percentage of all workers in analytical occupations: 35.7%
- Concentration of workers in analytical occupations (compared with average): +5.6%
- Total workers in analytical occupations: 350,780
- Total workers in non-analytical occupations: 631,760

12. Minneapolis-St. Paul-Bloomington, MN-WI

- Percentage of all workers in analytical occupations: 35.8%
- Concentration of workers in analytical occupations (compared with average): +5.9%
- Total workers in analytical occupations: 652,220
- Total workers in non-analytical occupations: 1,170,700
11. Seattle-Tacoma-Bellevue, WA

- Percentage of all workers in analytical occupations: 35.8%
- Concentration of workers in analytical occupations (compared with average): +5.9%
- Total workers in analytical occupations: 686,860
- Total workers in non-analytical occupations: 1,230,700
10. Philadelphia-Camden-Wilmington, PA-NJ-DE-MD

- Percentage of all workers in analytical occupations: 36.2%
- Concentration of workers in analytical occupations (compared with average): +7.1%
- Total workers in analytical occupations: 961,200
- Total workers in non-analytical occupations: 1,693,480
9. San Diego-Carlsbad, CA

- Percentage of all workers in analytical occupations: 36.3%
- Concentration of workers in analytical occupations (compared with average): +7.4%
- Total workers in analytical occupations: 505,230
- Total workers in non-analytical occupations: 885,180
8. Austin-Round Rock, TX

- Percentage of all workers in analytical occupations: 36.9%
- Concentration of workers in analytical occupations (compared with average): +9.2%
- Total workers in analytical occupations: 395,930
- Total workers in non-analytical occupations: 677,230
7. Denver-Aurora-Lakewood, CO

- Percentage of all workers in analytical occupations: 37.4%
- Concentration of workers in analytical occupations (compared with average): +10.7%
- Total workers in analytical occupations: 548,520
- Total workers in non-analytical occupations: 916,270
6. Baltimore-Columbia-Towson, MD

- Percentage of all workers in analytical occupations: 38.0%
- Concentration of workers in analytical occupations (compared with average): +12.4%
- Total workers in analytical occupations: 477,120
- Total workers in non-analytical occupations: 778,650
5. Hartford-West Hartford-East Hartford, CT

- Percentage of all workers in analytical occupations: 38.4%
- Concentration of workers in analytical occupations (compared with average): +13.6%
- Total workers in analytical occupations: 208,780
- Total workers in non-analytical occupations: 335,600
4. San Francisco-Oakland-Hayward, CA

- Percentage of all workers in analytical occupations: 39.0%
- Concentration of workers in analytical occupations (compared with average): +15.4%
- Total workers in analytical occupations: 874,080
- Total workers in non-analytical occupations: 1,368,110
3. San Jose-Sunnyvale-Santa Clara, CA
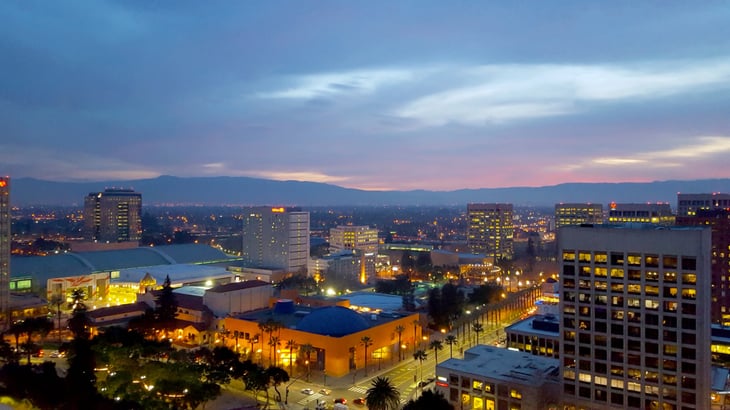
- Percentage of all workers in analytical occupations: 41.0%
- Concentration of workers in analytical occupations (compared with average): +21.3%
- Total workers in analytical occupations: 438,500
- Total workers in non-analytical occupations: 630,120
2. Boston-Cambridge-Nashua, MA-NH

- Percentage of all workers in analytical occupations: 41.9%
- Concentration of workers in analytical occupations (compared with average): +24.0%
- Total workers in analytical occupations: 1,084,120
- Total workers in non-analytical occupations: 1,501,020
1. Washington-Arlington-Alexandria, DC-VA-MD-WV

- Percentage of all workers in analytical occupations: 46.1%
- Concentration of workers in analytical occupations (compared with average): +36.4%
- Total workers in analytical occupations: 1,351,890
- Total workers in non-analytical occupations: 1,580,710
Methodology

The data used in this analysis is from the U.S. Bureau of Labor Statistics Occupational Employment and Wage Statistics as well as O*NET Online’s Critical Thinking index.
To determine the locations with the most analytical workers, researchers at Smartest Dollar calculated the percentage of all workers in analytical occupations — or occupations that rank in the top 50% for O*NET’s Critical Thinking index.
In the event of a tie, the location with the greater total workers in analytical occupations was ranked higher. To improve relevance, only metropolitan areas with at least 100,000 residents were included.
Add a Comment
Our Policy: We welcome relevant and respectful comments in order to foster healthy and informative discussions. All other comments may be removed. Comments with links are automatically held for moderation.