


Editor's Note: This story originally appeared on Upgraded Points.
While flying remains one of the safest forms of transportation, the U.S. aviation system has come under renewed scrutiny in recent years.
In January 2025, a mid-air collision over the Potomac River marked the first fatal crash involving a major U.S. commercial passenger flight in more than a decade.
A series of communication and radar outages earlier this year disrupted operations at multiple air traffic control towers, highlighting mounting strain on the national airspace system. And ongoing staffing shortages among air traffic controllers have been the cause of delays at major commercial hubs.
These incidents have unfolded alongside a rise in runway-related safety incidents. In 2023, a string of high-profile near misses drew national attention and ultimately prompted the Federal Aviation Administration (FAA) to issue a Safety Call to Action.
A central concern is runway incursions, which occur when aircraft, vehicles, or people enter active runway zones without clearance — posing serious risks during takeoffs and landings.
Amid these ongoing safety challenges, our research team set out to analyze whether runway near misses are becoming more common — and where they are happening most.
Drawing on data from the FAA’s Aviation Safety Information Analysis and Sharing (ASIAS) system, the analysis reviews runway incursions at major U.S. airports over the past four years. Find out more about the methodology at the end.
Here are America’s large airports with the highest number of near-miss incidents.
15. Denver International (DEN)

- City: Denver, CO
- Total Runway Incursions: 36
- High-Risk Runway Incursions (A and B): 0
- Lower-Risk Runway Incursions (C, D and E): 36
- Total Runway Incursions per 1 Million Flights: 14.0
- High-Risk Runway Incursions per 1 Million Flights: 0.0
- Total Operations: 2,563,450
14. Phoenix Sky Harbor International (PHX)
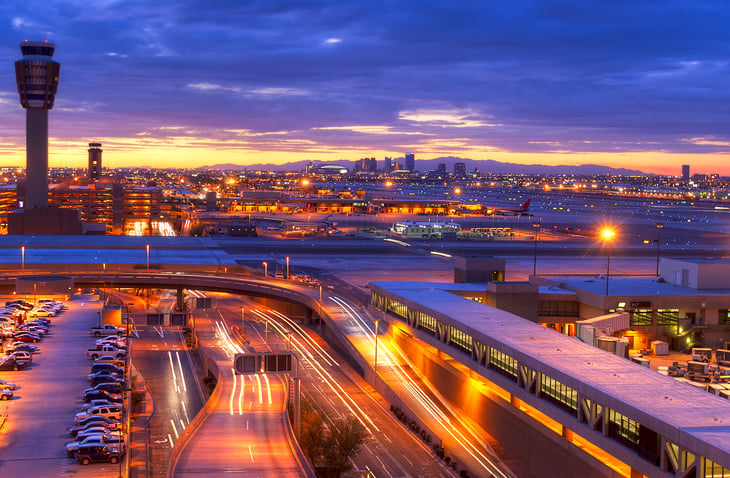
- City: Phoenix, AZ
- Total Runway Incursions: 37
- High-Risk Runway Incursions (A and B): 0
- Lower-Risk Runway Incursions (C, D and E): 37
- Total Runway Incursions per 1 Million Flights: 20.9
- High-Risk Runway Incursions per 1 Million Flights: 0.0
- Total Operations: 1,767,551
13. Newark Liberty International (EWR)

- City: Newark, NJ
- Total Runway Incursions: 37
- High-Risk Runway Incursions (A and B): 0
- Lower-Risk Runway Incursions (C, D and E): 37
- Total Runway Incursions per 1 Million Flights: 23.7
- High-Risk Runway Incursions per 1 Million Flights: 0.0
- Total Operations: 1,560,975
12. Miami International (MIA)
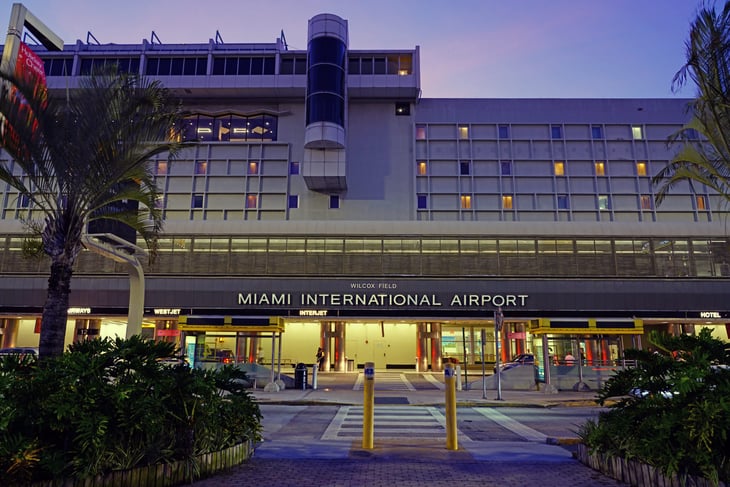
- City: Miami, FL
- Total Runway Incursions: 44
- High-Risk Runway Incursions (A and B): 0
- Lower-Risk Runway Incursions (C, D and E): 44
- Total Runway Incursions per 1 Million Flights: 24.5
- High-Risk Runway Incursions per 1 Million Flights: 0.0
- Total Operations: 1,793,691
11. Salt Lake City International (SLC)

- City: Salt Lake City, UT
- Total Runway Incursions: 48
- High-Risk Runway Incursions (A and B): 1
- Lower-Risk Runway Incursions (C, D and E): 47
- Total Runway Incursions per 1 Million Flights: 36.6
- High-Risk Runway Incursions per 1 Million Flights: 0.8
- Total Operations: 1,310,131
10. Harry Reid International (LAS)
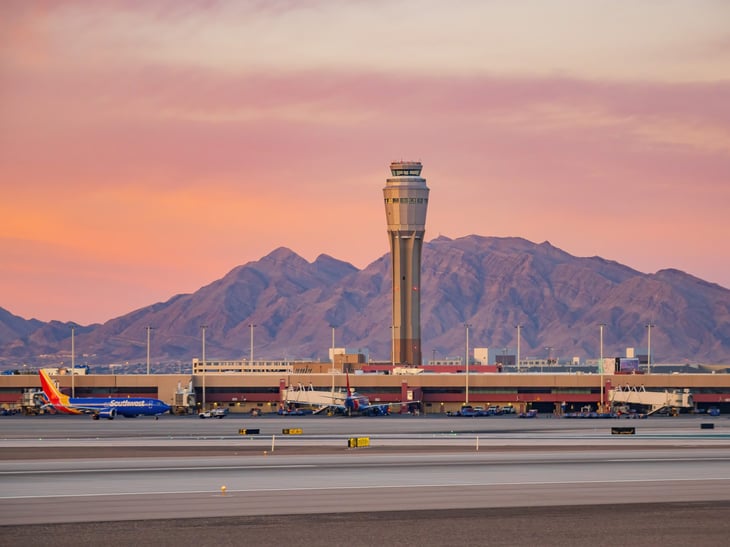
- City: Las Vegas, NV
- Total Runway Incursions: 52
- High-Risk Runway Incursions (A and B): 0
- Lower-Risk Runway Incursions (C, D and E): 52
- Total Runway Incursions per 1 Million Flights: 22.7
- High-Risk Runway Incursions per 1 Million Flights: 0.0
- Total Operations: 2,292,983

9. Ronald Reagan Washington National (DCA)

- City: Washington, DC
- Total Runway Incursions: 54
- High-Risk Runway Incursions (A and B): 0
- Lower-Risk Runway Incursions (C, D and E): 54
- Total Runway Incursions per 1 Million Flights: 50.4
- High-Risk Runway Incursions per 1 Million Flights: 0.0
- Total Operations: 1,071,027
8. Hartsfield-Jackson Atlanta International (ATL)
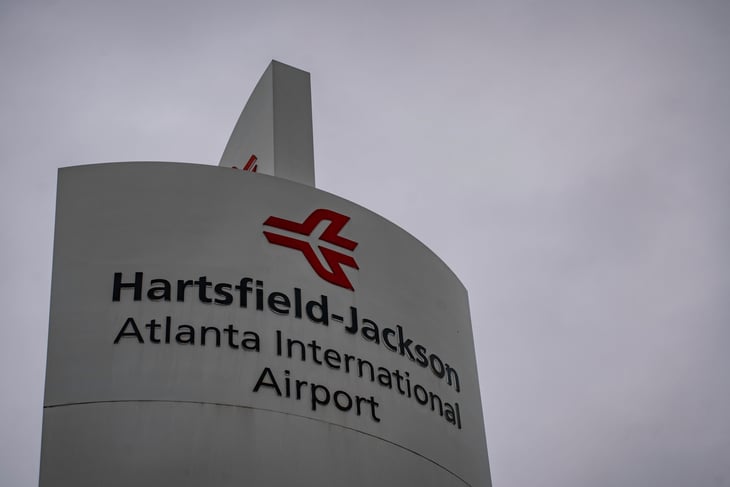
- City: Atlanta, GA
- Total Runway Incursions: 62
- High-Risk Runway Incursions (A and B): 1
- Lower-Risk Runway Incursions (C, D and E): 61
- Total Runway Incursions per 1 Million Flights: 20.6
- High-Risk Runway Incursions per 1 Million Flights: 0.3
- Total Operations: 3,003,848
7. San Francisco International (SFO)
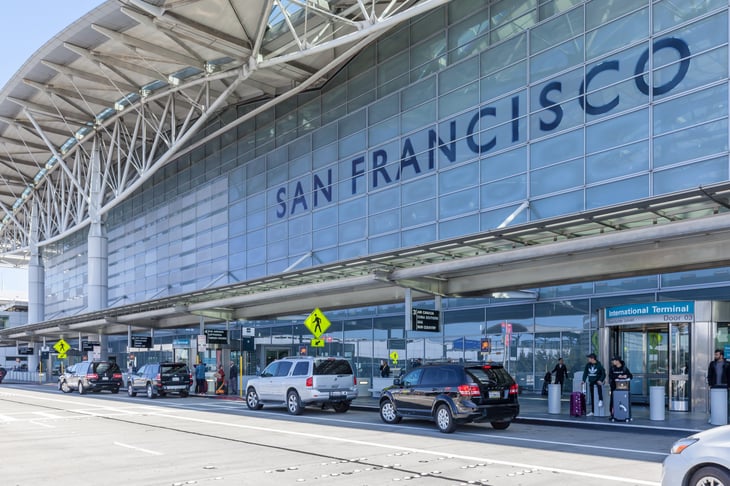
- City: San Francisco, CA
- Total Runway Incursions: 62
- High-Risk Runway Incursions (A and B): 3
- Lower-Risk Runway Incursions (C, D and E): 59
- Total Runway Incursions per 1 Million Flights: 44.5
- High-Risk Runway Incursions per 1 Million Flights: 2.2
- Total Operations: 1,393,031
6. Los Angeles International (LAX)
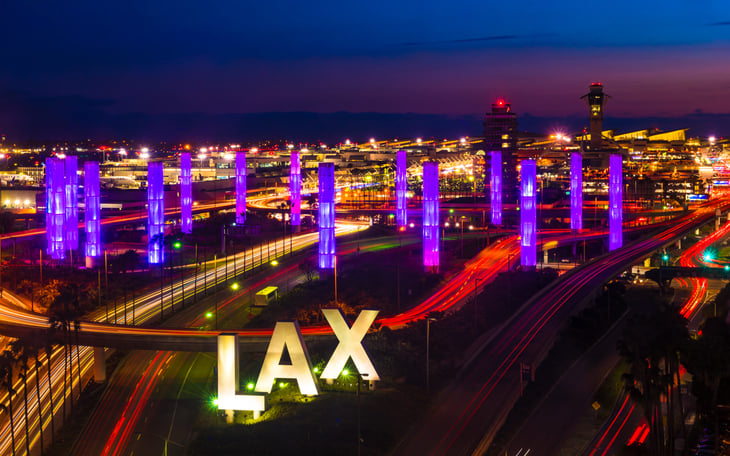
- City: Los Angeles, CA
- Total Runway Incursions: 68
- High-Risk Runway Incursions (A and B): 0
- Lower-Risk Runway Incursions (C, D and E): 68
- Total Runway Incursions per 1 Million Flights: 30.6
- High-Risk Runway Incursions per 1 Million Flights: 0.0
- Total Operations: 2,220,558
5. Dallas/Fort Worth International (DFW)

- City: Dallas/Fort Worth, TX
- Total Runway Incursions: 71
- High-Risk Runway Incursions (A and B): 0
- Lower-Risk Runway Incursions (C, D and E): 71
- Total Runway Incursions per 1 Million Flights: 25.9
- High-Risk Runway Incursions per 1 Million Flights: 0.0
- Total Operations: 2,741,343
4. Daniel K. Inouye International (HNL)
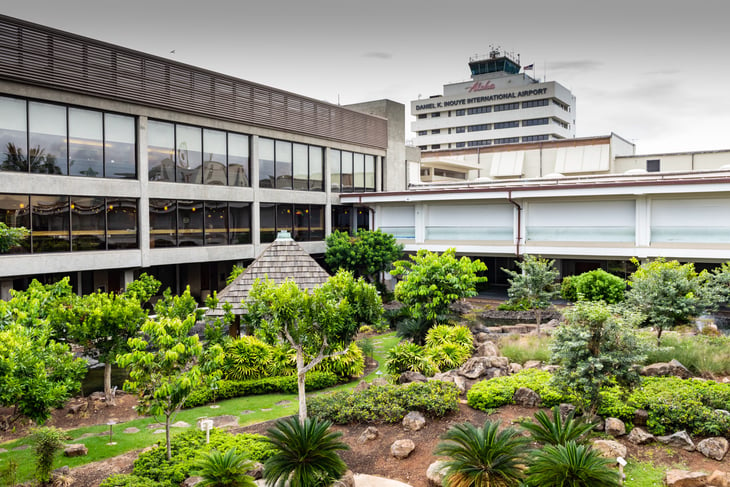
- City: Honolulu, HI
- Total Runway Incursions: 71
- High-Risk Runway Incursions (A and B): 1
- Lower-Risk Runway Incursions (C, D and E): 70
- Total Runway Incursions per 1 Million Flights: 56.7
- High-Risk Runway Incursions per 1 Million Flights: 0.8
- Total Operations: 1,251,679
3. Chicago O’Hare International (ORD)
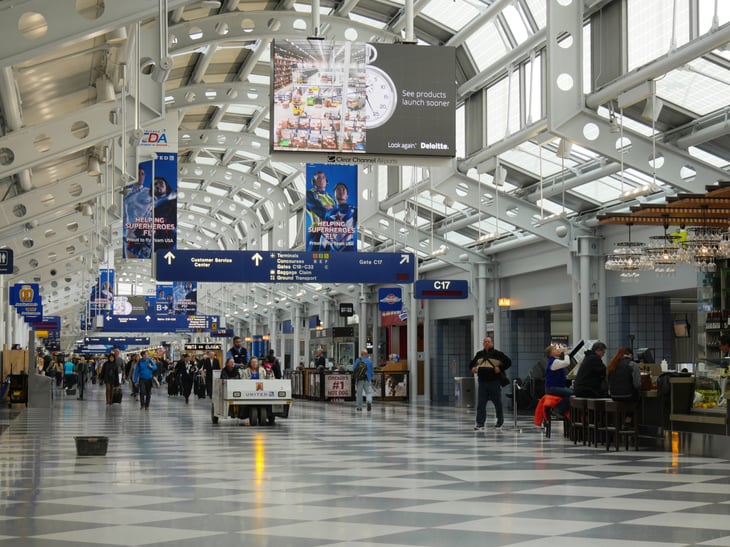
- City: Chicago, IL
- Total Runway Incursions: 83
- High-Risk Runway Incursions (A and B): 0
- Lower-Risk Runway Incursions (C, D and E): 83
- Total Runway Incursions per 1 Million Flights: 28.7
- High-Risk Runway Incursions per 1 Million Flights: 0.0
- Total Operations: 2,892,380
2. Logan International (BOS)

- City: Boston, MA
- Total Runway Incursions: 83
- High-Risk Runway Incursions (A and B): 2
- Lower-Risk Runway Incursions (C, D and E): 81
- Total Runway Incursions per 1 Million Flights: 56.4
- High-Risk Runway Incursions per 1 Million Flights: 1.4
- Total Operations: 1,471,728
1. Chicago Midway International (MDW)

- City: Chicago, IL
- Total Runway Incursions: 89
- High-Risk Runway Incursions (A and B): 2
- Lower-Risk Runway Incursions (C, D and E): 87
- Total Runway Incursions per 1 Million Flights: 103.9
- High-Risk Runway Incursions per 1 Million Flights: 2.3
- Total Operations: 856,415
Methodology

This analysis uses data from the Federal Aviation Administration’s Aviation Safety Information Analysis and Sharing (ASIAS) system, which compiles detailed records of aviation safety events, including runway incursions, across the United States.
A runway incursion occurs when an aircraft, vehicle, or person enters the protected area of a runway without authorization, creating a potential collision risk. These incidents are categorized by severity:
- Category A: A serious incident in which a collision was narrowly avoided.
- Category B: An incident with significant potential for collision that required immediate corrective action.
- Category C: An incident with ample time or distance to avoid a collision, but which still posed some risk.
- Category D: An incident with little or no immediate safety consequences, but still meets the definition of a runway incursion.
- Category E: Rare incidents with insufficient or conflicting information that prevents them from being properly categorized.
To determine which U.S. airports experienced the most runway incursions, Upgraded Points analyzed ASIAS data covering a four-year period from 2021 through 2024, the most recent years with complete records available.
Airports were ranked based on their total number of runway incursions during this timeframe. In the event of ties, higher priority was first given to airports with a greater number of Category A or B incursions, reflecting more serious safety risks, and then to airports with a higher rate of incursions per 1 million flight operations.

Add a Comment