


Editor's Note: This story originally appeared on Construction Coverage.
The need for affordable housing in the United States has never been greater.
After a dizzying run-up in residential real estate prices and rents in the last few years, housing costs are putting a financial squeeze on renters and homebuyers nationwide as they compete for a scarce, expensive supply of housing.
While the national supply of housing has been lagging overall, some parts of the country have managed to add homes faster than others.
But rates of housing supply growth may not be sufficient to understand how well a location is meeting current and future housing needs. In some places, housing growth is exceeding the rate of population growth, which positions those markets to keep housing affordable now while also being better able to accommodate new residents in the future.
The following is a breakdown of housing growth across U.S. counties. The analysis was conducted by Construction Coverage, using data from the Census Bureau and Zillow. For more information, see the methodology section at the end.
1. Williamson County, TX

- Metro/micro area: Austin-Round Rock-San Marcos, TX
- Percentage change in housing units (2012–2022): +58.6%
- Percentage change in population (2012–2022): +47.2%
- Total change in housing units (2012–2022): +97,915
- Total change in population (2012–2022): +215,186
- Total housing units (2022): 265,118
- Total population (2022): 671,418
- Percentage change in median home price (2012–2022): +167.3%
2. Fort Bend County, TX
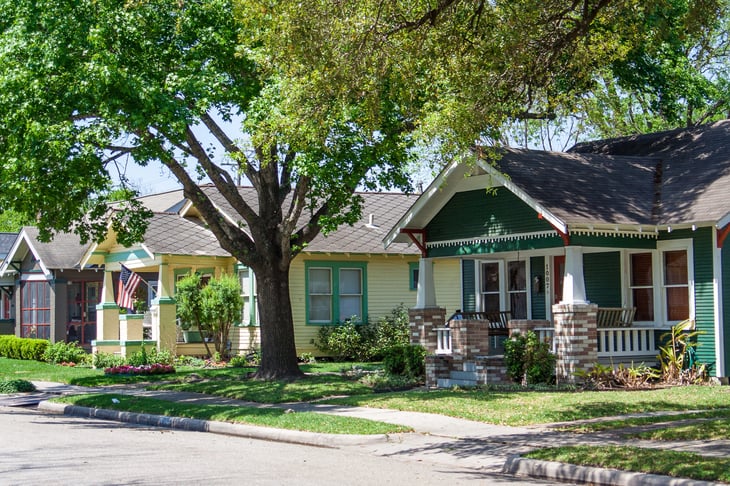
- Metro/micro area: Houston-Pasadena-The Woodlands, TX
- Percentage change in housing units (2012–2022): +46.7%
- Percentage change in population (2012–2022): +41.7%
- Total change in housing units (2012–2022): +97,282
- Total change in population (2012–2022): +261,853
- Total housing units (2022): 305,748
- Total population (2022): 889,146
- Percentage change in median home price (2012–2022): +96.9%
3. Montgomery County, TX
- Metro/micro area: Houston-Pasadena-The Woodlands, TX
- Percentage change in housing units (2012–2022): +43.4%
- Percentage change in population (2012–2022): +39.9%
- Total change in housing units (2012–2022): +80,291
- Total change in population (2012–2022): +193,443
- Total housing units (2022): 265,140
- Total population (2022): 678,490
- Percentage change in median home price (2012–2022): +95.5%

4. Denton County, TX

- Metro/micro area: Dallas-Fort Worth-Arlington, TX
- Percentage change in housing units (2012–2022): +41.4%
- Percentage change in population (2012–2022): +38.2%
- Total change in housing units (2012–2022): +110,263
- Total change in population (2012–2022): +269,977
- Total housing units (2022): 376,640
- Total population (2022): 977,281
- Percentage change in median home price (2012–2022): +141.0%
5. Collin County, TX

- Metro/micro area: Dallas-Fort Worth-Arlington, TX
- Percentage change in housing units (2012–2022): +40.3%
- Percentage change in population (2012–2022): +38.8%
- Total change in housing units (2012–2022): +125,164
- Total change in population (2012–2022): +324,054
- Total housing units (2022): 436,091
- Total population (2022): 1,158,696
- Percentage change in median home price (2012–2022): +146.4%
6. Utah County, UT
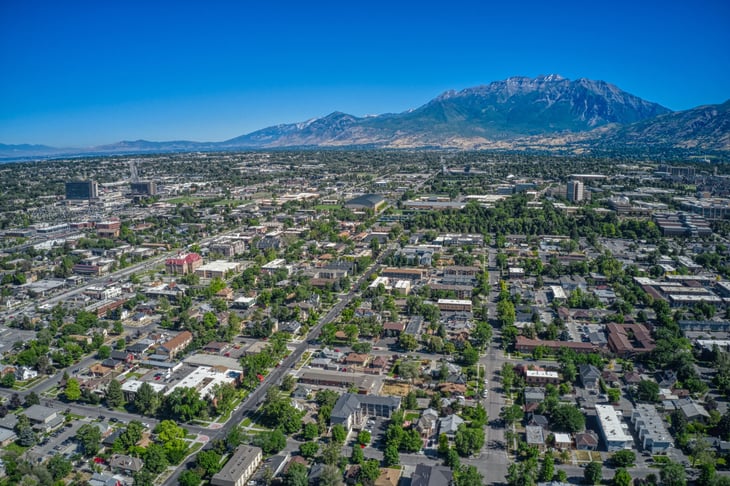
- Metro/micro area: Provo-Orem-Lehi, UT
- Percentage change in housing units (2012–2022): +40.0%
- Percentage change in population (2012–2022): +30.0%
- Total change in housing units (2012–2022): +60,750
- Total change in population (2012–2022): +161,930
- Total housing units (2022): 212,767
- Total population (2022): 702,434
- Percentage change in median home price (2012–2022): +182.1%
7. Travis County, TX

- Metro/micro area: Austin-Round Rock-San Marcos, TX
- Percentage change in housing units (2012–2022): +37.7%
- Percentage change in population (2012–2022): +21.1%
- Total change in housing units (2012–2022): +170,103
- Total change in population (2012–2022): +230,852
- Total housing units (2022): 620,979
- Total population (2022): 1,326,436
- Percentage change in median home price (2012–2022): +179.1%
8. Ada County, ID
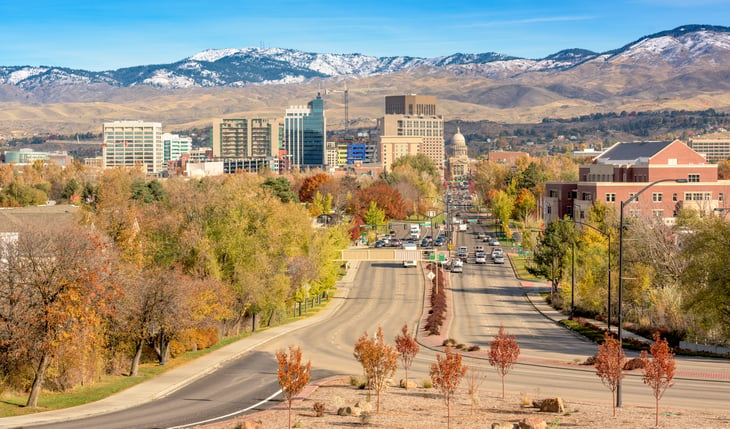
- Metro/micro area: Boise City, ID
- Percentage change in housing units (2012–2022): +30.9%
- Percentage change in population (2012–2022): +26.9%
- Total change in housing units (2012–2022): +50,086
- Total change in population (2012–2022): +109,846
- Total housing units (2022): 211,962
- Total population (2022): 518,907
- Percentage change in median home price (2012–2022): +239.6%
9. Wake County, NC
- Metro/micro area: Raleigh-Cary, NC
- Percentage change in housing units (2012–2022): +29.3%
- Percentage change in population (2012–2022): +23.4%
- Total change in housing units (2012–2022): +111,828
- Total change in population (2012–2022): +222,870
- Total housing units (2022): 493,222
- Total population (2022): 1,175,021
- Percentage change in median home price (2012–2022): +118.8%
10. Mecklenburg County, NC
- Metro/micro area: Charlotte-Concord-Gastonia, NC-SC
- Percentage change in housing units (2012–2022): +25.4%
- Percentage change in population (2012–2022): +18.2%
- Total change in housing units (2012–2022): +102,358
- Total change in population (2012–2022): +176,361
- Total housing units (2022): 505,942
- Total population (2022): 1,145,392
- Percentage change in median home price (2012–2022): +158.1%
11. Denver County, CO

- Metro/micro area: Denver-Aurora-Centennial, CO
- Percentage change in housing units (2012–2022): +25.3%
- Percentage change in population (2012–2022): +12.5%
- Total change in housing units (2012–2022): +73,021
- Total change in population (2012–2022): +78,987
- Total housing units (2022): 361,212
- Total population (2022): 713,252
- Percentage change in median home price (2012–2022): +159.6%
12. Davidson County, TN
- Metro/micro area: Nashville-Davidson–Murfreesboro–Franklin, TN
- Percentage change in housing units (2012–2022): +24.9%
- Percentage change in population (2012–2022): +9.2%
- Total change in housing units (2012–2022): +71,418
- Total change in population (2012–2022): +59,849
- Total housing units (2022): 358,163
- Total population (2022): 708,144
- Percentage change in median home price (2012–2022): +170.0%
13. Clark County, WA

- Metro/micro area: Portland-Vancouver-Hillsboro, OR-WA
- Percentage change in housing units (2012–2022): +22.3%
- Percentage change in population (2012–2022): +17.9%
- Total change in housing units (2012–2022): +37,719
- Total change in population (2012–2022): +78,492
- Total housing units (2022): 206,610
- Total population (2022): 516,779
- Percentage change in median home price (2012–2022): +165.8%
14. Bexar County, TX

- Metro/micro area: San Antonio-New Braunfels, TX
- Percentage change in housing units (2012–2022): +22.3%
- Percentage change in population (2012–2022): +15.3%
- Total change in housing units (2012–2022): +149,424
- Total change in population (2012–2022): +273,826
- Total housing units (2022): 820,113
- Total population (2022): 2,059,530
- Percentage change in median home price (2012–2022): +117.4%
15. Salt Lake County, UT

- Metro/micro area: Salt Lake City-Murray, UT
- Percentage change in housing units (2012–2022): +22.2%
- Percentage change in population (2012–2022): +11.5%
- Total change in housing units (2012–2022): +81,938
- Total change in population (2012–2022): +122,415
- Total housing units (2022): 451,040
- Total population (2022): 1,186,257
- Percentage change in median home price (2012–2022): +175.7%
Methodology

Population and housing unit estimates are from the U.S. Census Bureau’s American Community Survey 1-Year Estimates (2012 and 2022). Median home prices are from Zillow’s Housing Data Series.
All changes were calculated between 2012 and 2022. Only locations with data available from the Census Bureau were included in the analysis.
Add a Comment
Our Policy: We welcome relevant and respectful comments in order to foster healthy and informative discussions. All other comments may be removed. Comments with links are automatically held for moderation.