


Editor's Note: This story originally appeared on Farm Flavor.
From the eggs on our breakfast plate to the ice cream we enjoy after dinner — not to mention the clothes on our backs and the gas in our cars — the food, fiber and fuel we use every day can be traced back to a U.S. farmer.
Farming has a major impact on our daily lives, and it’s worth reflecting on where these agricultural products come from — and who produces them. While the U.S. food system is supported by global trade, the vast majority of what Americans eat is still grown or raised at home.
According to the U.S. Department of Agriculture’s Economic Research Service, imports account for less than 20% of U.S. food and beverage spending, underscoring the central role of domestic agriculture in feeding (along with clothing and fueling) the nation.
While all states contribute to the national food supply, a smaller group of high-output states dominate the industry in terms of total market value.
Here’s a look at the states that generate the most money from agricultural sales.
10. Wisconsin

- Market value of agricultural products sold: $18,448,578,176
- Share of total U.S. agricultural value: 3.1%
- Most valuable agricultural products: Milk from cows
- Crop sales: $7,101,119,108
- Livestock and other animal product sales: $11,347,459,068
- Number of farms: 58,521
- Agriculture share of total land area: 39.8%
- Agriculture share of total employment: 1.9%
9. Indiana

- Market value of agricultural products sold: $19,918,223,052
- Share of total U.S. agricultural value: 3.3%
- Most valuable agricultural products: Grains, oilseeds, dry beans, dry peas
- Crop sales: $13,025,841,104
- Livestock and other animal product sales: $6,892,383,053
- Number of farms: 53,599
- Agriculture share of total land area: 63.7%
- Agriculture share of total employment: 1.1%
8. North Carolina

- Market value of agricultural products sold: $20,651,293,852
- Share of total U.S. agricultural value: 3.4%
- Most valuable agricultural products: Poultry and eggs
- Crop sales: $5,208,788,636
- Livestock and other animal product sales: $15,442,505,215
- Number of farms: 42,817
- Agriculture share of total land area: 26.1%
- Agriculture share of total employment: 0.9%
7. Kansas

- Market value of agricultural products sold: $26,498,452,138
- Share of total U.S. agricultural value: 4.4%
- Most valuable agricultural products: Cattle and calves
- Crop sales: $9,297,895,454
- Livestock and other animal product sales: $17,200,556,683
- Number of farms: 55,734
- Agriculture share of total land area: 85.6%
- Agriculture share of total employment: 2.6%

6. Illinois
- Market value of agricultural products sold: $29,185,293,872
- Share of total U.S. agricultural value: 4.9%
- Most valuable agricultural products: Grains, oilseeds, dry beans, dry peas
- Crop sales: $24,625,480,831
- Livestock and other animal product sales: $4,559,813,041
- Number of farms: 71,123
- Agriculture share of total land area: 74.0%
- Agriculture share of total employment: 0.9%
5. Minnesota

- Market value of agricultural products sold: $31,466,621,700
- Share of total U.S. agricultural value: 5.2%
- Most valuable agricultural products: Grains, oilseeds, dry beans, dry peas
- Crop sales: $18,940,193,578
- Livestock and other animal product sales: $12,526,427,017
- Number of farms: 65,531
- Agriculture share of total land area: 49.9%
- Agriculture share of total employment: 1.9%
4. Nebraska
- Market value of agricultural products sold: $32,495,509,996
- Share of total U.S. agricultural value: 5.4%
- Most valuable agricultural products: Grains, oilseeds, dry beans, dry peas
- Crop sales: $15,475,808,989
- Livestock and other animal product sales: $17,019,701,007
- Number of farms: 44,479
- Agriculture share of total land area: 89.4%
- Agriculture share of total employment: 4.1%
3. Texas
- Market value of agricultural products sold: $35,537,165,904
- Share of total U.S. agricultural value: 5.9%
- Most valuable agricultural products: Cattle and calves
- Crop sales: $8,005,994,072
- Livestock and other animal product sales: $27,531,171,832
- Number of farms: 230,662
- Agriculture share of total land area: 75.0%
- Agriculture share of total employment: 0.7%
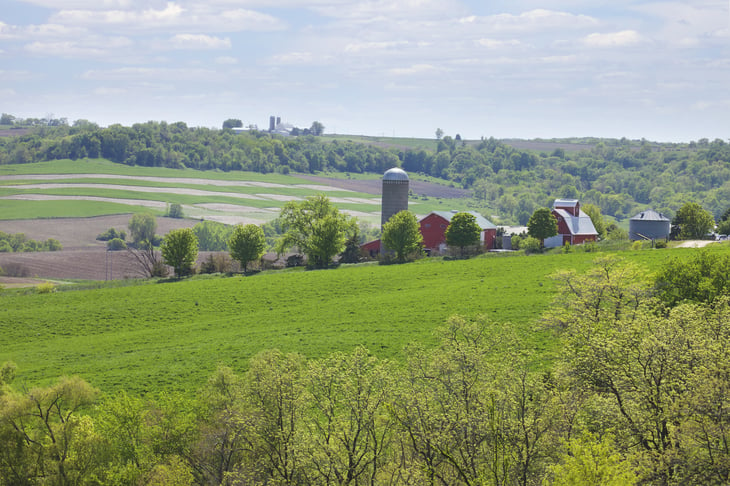
2. Iowa
- Market value of agricultural products sold: $48,539,311,558
- Share of total U.S. agricultural value: 8.1%
- Most valuable agricultural products: Grains, oilseeds, dry beans, dry peas
- Crop sales: $26,034,040,985
- Livestock and other animal product sales: $22,505,270,573
- Number of farms: 86,911
- Agriculture share of total land area: 83.9%
- Agriculture share of total employment: 3.5%
1. California

- Market value of agricultural products sold: $65,188,643,005
- Share of total U.S. agricultural value: 10.9%
- Most valuable agricultural products: Fruits, tree nuts, berries
- Crop sales: $47,472,751,164
- Livestock and other animal product sales: $17,715,891,841
- Number of farms: 63,134
- Agriculture share of total land area: 24.3%
- Agriculture share of total employment: 1.9%
Methodology
This analysis draws on data from four primary federal sources: the USDA Census of Agriculture, the USDA Economic Research Service (ERS), the U.S. Census Bureau’s American Community Survey (ACS) 1-Year Estimates and the U.S. Bureau of Labor Statistics Consumer Price Index (CPI).
Researchers examined both state-level and county-level data to identify the top agricultural hubs across the United States.
Locations were ranked based on the total annual market value of all agricultural products sold, encompassing both crops and livestock. All financial figures were adjusted to 2025 dollars using the CPI to ensure consistency across regions.
Additional indicators from the USDA and ACS, including the number of farms, total agricultural land area and agricultural employment, were also included.

Add a Comment