


Editor's Note: This story originally appeared on Trace One.
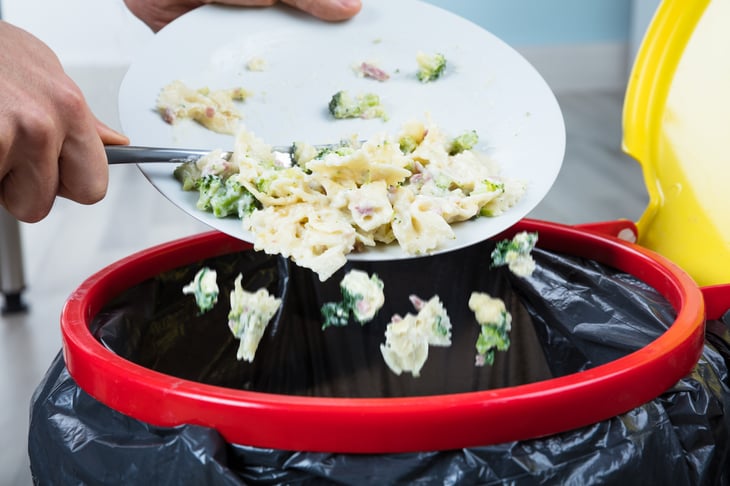
Food waste continues to be a significant concern in the United States, presenting both financial and environmental challenges. According to government estimates, between 30% and 40% of the nation’s food supply is wasted annually, translating to millions of tons — and billions of dollars — lost.
This not only impacts individual household budgets but also exacerbates economic inefficiencies and environmental degradation, contributing to air pollution, soil and water degradation, and greenhouse gas emissions.
Not every household may be thinking about the environmental impacts of their wasted food, but many more might be surprised to learn the extent of food waste’s financial impacts. On average, U.S. households lose more than $2,000 per year to food waste, while individuals lose an average of $792 — the equivalent of 214 meals.
While food waste is a major nationwide problem, households in certain parts of the U.S. are more likely than others to lose money to food waste as a result of differences in food prices and purchasing patterns.
Here are the states where Americans lose the most money to food waste. Learn about the details of the methodology at the end.
15. Maryland

- Annual money lost to food waste per household: $2,213
- Annual money lost to food waste per person: $853
- Annual meals lost to food waste per person: 216
- Total money lost to food waste across all households: $5,258,012,721
- Share of food waste sent to landfill, sewer, or incinerator: 69.5%
- Share of food waste composted: 30.5%
14. South Carolina

- Annual money lost to food waste per household: $2,236
- Annual money lost to food waste per person: $904
- Annual meals lost to food waste per person: 247
- Total money lost to food waste across all households: $4,776,913,893
- Share of food waste sent to landfill, sewer, or incinerator: 70.5%
- Share of food waste composted: 29.5%
13. Nevada

- Annual money lost to food waste per household: $2,258
- Annual money lost to food waste per person: $852
- Annual meals lost to food waste per person: 236
- Total money lost to food waste across all households: $2,706,355,133
- Share of food waste sent to landfill, sewer, or incinerator: 69.3%
- Share of food waste composted: 30.7%

12. North Carolina

- Annual money lost to food waste per household: $2,259
- Annual money lost to food waste per person: $908
- Annual meals lost to food waste per person: 251
- Total money lost to food waste across all households: $9,710,936,163
- Share of food waste sent to landfill, sewer, or incinerator: 70.2%
- Share of food waste composted: 29.8%
11. Georgia

- Annual money lost to food waste per household: $2,264
- Annual money lost to food waste per person: $849
- Annual meals lost to food waste per person: 227
- Total money lost to food waste across all households: $9,264,609,609
- Share of food waste sent to landfill, sewer, or incinerator: 70.3%
- Share of food waste composted: 29.7%
10. Wyoming

- Annual money lost to food waste per household: $2,297
- Annual money lost to food waste per person: $961
- Annual meals lost to food waste per person: 264
- Total money lost to food waste across all households: $558,995,966
- Share of food waste sent to landfill, sewer, or incinerator: 70.5%
- Share of food waste composted: 29.5%
9. Connecticut

- Annual money lost to food waste per household: $2,313
- Annual money lost to food waste per person: $914
- Annual meals lost to food waste per person: 231
- Total money lost to food waste across all households: $3,315,593,713
- Share of food waste sent to landfill, sewer, or incinerator: 68.8%
- Share of food waste composted: 31.2%
8. Arizona

- Annual money lost to food waste per household: $2,355
- Annual money lost to food waste per person: $912
- Annual meals lost to food waste per person: 271
- Total money lost to food waste across all households: $6,713,692,171
- Share of food waste sent to landfill, sewer, or incinerator: 69.3%
- Share of food waste composted: 30.7%
7. Virginia

- Annual money lost to food waste per household: $2,480
- Annual money lost to food waste per person: $965
- Annual meals lost to food waste per person: 255
- Total money lost to food waste across all households: $8,382,265,253
- Share of food waste sent to landfill, sewer, or incinerator: 70.0%
- Share of food waste composted: 30.0%
6. Alaska

- Annual money lost to food waste per household: $2,490
- Annual money lost to food waste per person: $932
- Annual meals lost to food waste per person: 209
- Total money lost to food waste across all households: $683,601,051
- Share of food waste sent to landfill, sewer, or incinerator: 70.4%
- Share of food waste composted: 29.6%
5. Massachusetts

- Annual money lost to food waste per household: $2,536
- Annual money lost to food waste per person: $1,016
- Annual meals lost to food waste per person: 255
- Total money lost to food waste across all households: $7,096,349,868
- Share of food waste sent to landfill, sewer, or incinerator: 68.6%
- Share of food waste composted: 31.4%
4. Colorado

- Annual money lost to food waste per household: $2,561
- Annual money lost to food waste per person: $1,046
- Annual meals lost to food waste per person: 274
- Total money lost to food waste across all households: $6,107,541,630
- Share of food waste sent to landfill, sewer, or incinerator: 69.5%
- Share of food waste composted: 30.5%
3. Maine

- Annual money lost to food waste per household: $2,633
- Annual money lost to food waste per person: $1,151
- Annual meals lost to food waste per person: 293
- Total money lost to food waste across all households: $1,594,004,605
- Share of food waste sent to landfill, sewer, or incinerator: 70.0%
- Share of food waste composted: 30.0%
2. Florida

- Annual money lost to food waste per household: $2,816
- Annual money lost to food waste per person: $1,118
- Annual meals lost to food waste per person: 268
- Total money lost to food waste across all households: $24,859,490,832
- Share of food waste sent to landfill, sewer, or incinerator: 70.0%
- Share of food waste composted: 30.0%
1. New Hampshire

- Annual money lost to food waste per household: $3,363
- Annual money lost to food waste per person: $1,343
- Annual meals lost to food waste per person: 361
- Total money lost to food waste across all households: $1,873,761,207
- Share of food waste sent to landfill, sewer, or incinerator: 69.7%
- Share of food waste composted: 30.3%
Methodology

This analysis was conducted by Trace One — a company providing PLM and compliance software for food and beverage manufacturers and CPG retailers — using data from ReFED.org’s Food Waste Monitor, the U.S. Census Bureau’s American Community Survey, and the U.S. Bureau of Labor Statistics’ Consumer Price Index.
State-level statistics represent the residential sector only (i.e., these do not include excess food allocated to the food service, farm, retail, or manufacturing sectors). All 2022 dollar figures were inflation-adjusted to current values based on the CPI for food at home.

Add a Comment