


Editor's Note: This story originally appeared on Forbes Advisor.
Mickey and Minnie Mouse come across as a happy couple without a care in the world, right? Well, we don’t know what Mickey and Minnie think, but a lot of travelers appear to be unhappy with the Southern California airport that’s closest to the pair’s Los Angeles-area workplace — Disneyland.
Based on Twitter activity, John Wayne Airport in Orange County, California, angers its travelers more than any other U.S. airport, with nearly two-thirds (65%) of tweets about it characterized as “angry.”
To arrive at that conclusion, Forbes Advisor analyzed more than 37,000 tweets directed at the 60 busiest airports in the U.S. from March 2022 to March 2023. We then used a machine learning tool to analyze the sentiment of each tweet and determine where travelers are most annoyed.
By comparison, travelers fumed in a lower percentage of tweets targeted at two neighboring airports — Los Angeles International Airport (55%) and Hollywood Burbank Airport (54%).
Elsewhere, Indianapolis International Airport grabbed the award for the least hacked-off air travelers on Twitter, one of the internet’s favorite places to gripe. Here are the angriest airports in the U.S.
1. John Wayne Airport
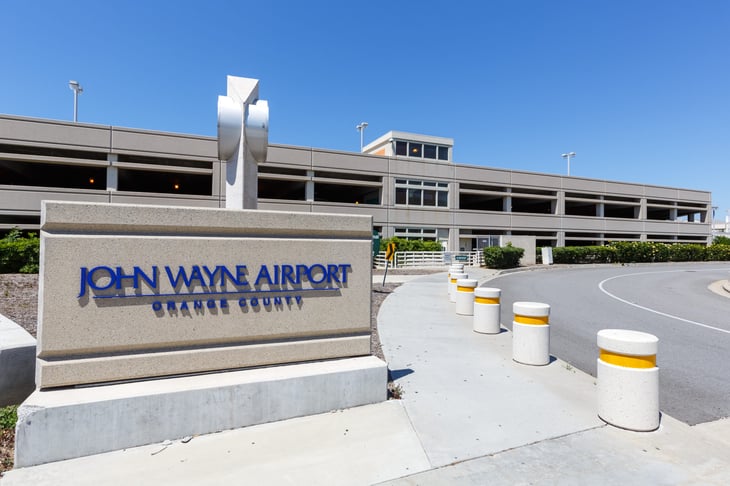
- City: Orange County
- State: CA
- Percentage of tweets that were angry: 65
- Top words: Noise, Staff, TSA, Complaints, Delayed
2. Jacksonville International Airport

- City: Jacksonville
- State: FL
- Percentage of tweets that were angry: 60
- Top words: Line, TSA, Garage, Delays, Employees
3. Eppley Airfield
- City: Omaha
- State: NE
- Percentage of tweets that were angry: 59
- Top words: Delays, Weather, Cold, Police, Issues
4. Tampa International Airport
- City: Tampa
- State: FL
- Percentage of tweets that were angry: 57
- Top words: Bags, Delayed, Luggage, Security, Canceled
5. San Antonio International Airport
- City: San Antonio
- State: TX
- Percentage of tweets that were angry: 57
- Top words: TSA, Weapon, Officers, Firearm, Broken
6. Hartsfield–Jackson Atlanta International Airport
- City: Atlanta
- State: GA
- Percentage of tweets that were angry: 56
- Top words: Delays, Traffic, Line, Security, Parking
7. San Diego International Airport
- City: San Diego
- State: CA
- Percentage of tweets that were angry: 56
- Top words: Waiting, Security, Line, Rental, Canceled
8. Nashville International Airport
- City: Nashville
- State: TN
- Percentage of tweets that were angry: 56
- Top words: Traffic, Police, Waiting, Passengers, Security
9. Phoenix Sky Harbor International Airport
- City: Phoenix
- State: AZ
- Percentage of tweets that were angry: 56
- Top words: Rental, Line, Waiting, Bags, Delayed
10. Norman Y. Mineta San Jose International Airport
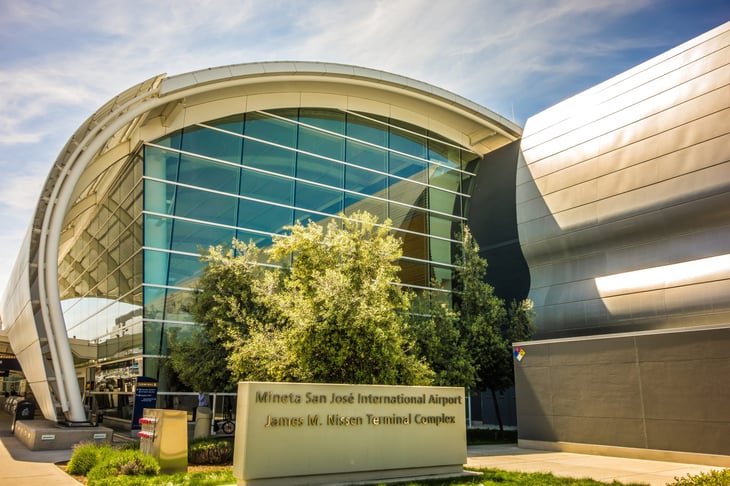
- City: San Jose
- State: CA
- Percentage of tweets that were angry: 56
- Top words: Help, Security, International, Waiting, Parking
11. Milwaukee Mitchell International Airport
- City: Milwaukee
- State: WI
- Percentage of tweets that were angry: 55
- Top words: Delays, Cancellations, Recalled, Lost, Southwest
12. Los Angeles International Airport
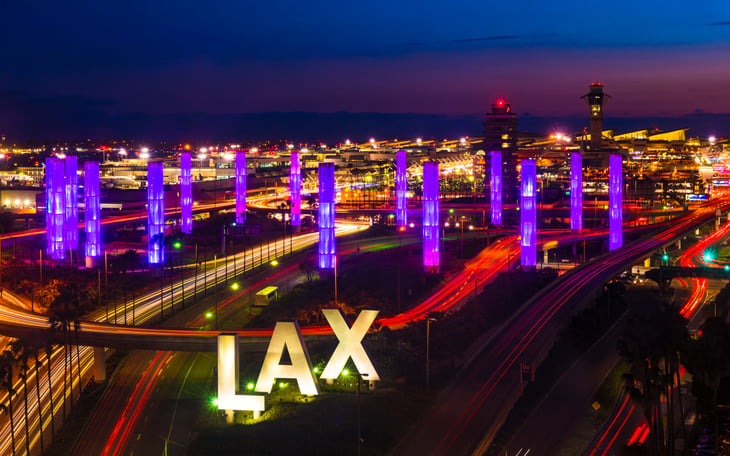
- City: Los Angeles
- State: CA
- Percentage of tweets that were angry: 55
- Top words: Hours, Traffic, TSA, Waiting, Lost
13. Hollywood Burbank Airport
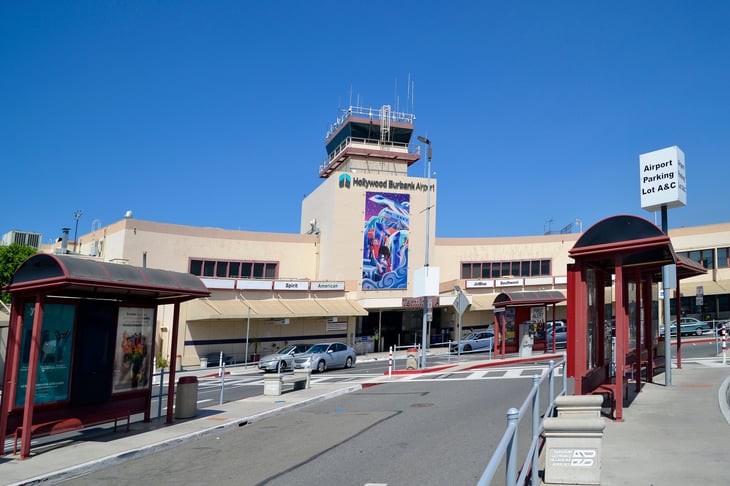
- City: Burbank
- State: CA
- Percentage of tweets that were angry: 54
- Top words: Concentrated, Complaints, People, Noise, Illegal
14. Pittsburgh International Airport
- City: Pittsburgh
- State: PA
- Percentage of tweets that were angry: 54
- Top words: Security, Bag, Parking, Luggage, Years
15. Denver International Airport
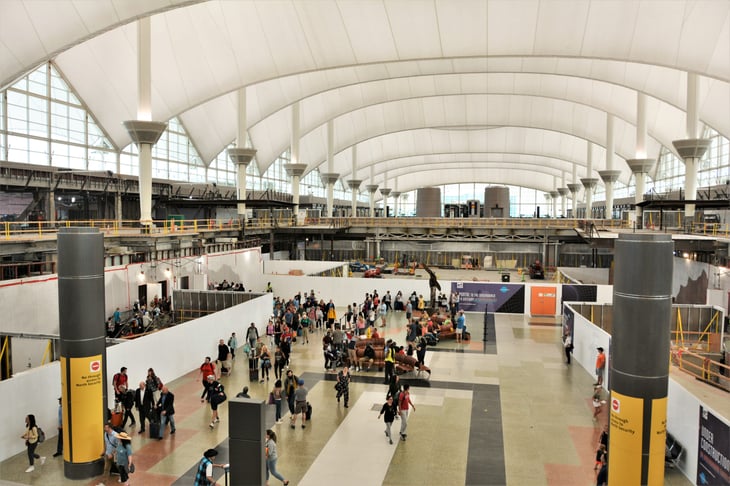
- City: Denver
- State: CO
- Percentage of tweets that were angry: 54
- Top words: Security, Line, TSA, Delays, Luggage
Methodology

In March 2023, we analyzed more than 37,000 tweets directed at the 60 busiest airports in the United States over the preceding 12 months. We established the list of airports based on total passenger boardings in 2021, as reported by the FAA.
A given tweet was designated as being directed at one of the airports if the tweet cited the official Twitter handle of that airport in its message, informally known as “@ mentioning” or “@-ing” an entity.
Once we amassed our raw set of tweets, we processed them with a Python-based machine learning tool that measures the sentiment of language in each tweet. Each tweet was scored on characteristics of “sadness,” “joy,” “love,” “anger,” “fear,” and “surprise.”
Then each tweet was tagged with the emotion it scored highest for. In this case, we focused our analysis exclusively on tweets tagged as “anger.” To establish airports with the angriest travelers we calculated the total number of angry tweets as a proportion of all tweets directed at that airport.
It’s important to note that on Twitter, there is a considerable ecosystem of non-traveler entities tweeting at airports on a regular basis, ranging from local TSA accounts to news media to aviation industry analysts. To focus our analysis on tweets from average travelers, and to filter out recurring @ mentions from non-travelers, we only analyzed tweets from Twitter handles that @ mentioned an airport four times or less in the past year.
Of the 60 busiest airports, seven were excluded from our analysis for either not having an official Twitter handle (OGG, SJU, HNL) or not being tweeted at more than 50 times over the past year (ANC, PBI, MSY, SMF).
Add a Comment
Our Policy: We welcome relevant and respectful comments in order to foster healthy and informative discussions. All other comments may be removed. Comments with links are automatically held for moderation.