


Editor's Note: This story originally appeared on LawnStarter.
If you’re more of a Linus than a Charlie Brown, then you appreciate a good pumpkin patch. But you don’t have to wait for the Great Pumpkin to appear on Pumpkin Day (Halloween night) to start enjoying all things pumpkin — or pumpkin spice.
LawnStarter compared nearly 200 of the biggest U.S. cities to rank 2021’s Best Cities for Pumpkin Lovers.
We looked for cities with easy access to pumpkin patches, lots of pumpkin-related events, and high community interest. We also searched for cities with plenty of bakeries and coffee shops, where you might be lucky enough to find delicious pumpkin treats and pumpkin spice lattes.
Check out our ranking below, followed by some highlights and lowlights.
For pumpkin nuts, finding fall activities in these cities and surrounding areas will be as easy as pumpkin pie.
1. Portland, OR

Overall Score: 49.27
Access Rank: 1
Popularity Rank: 145
2. Worcester, MA
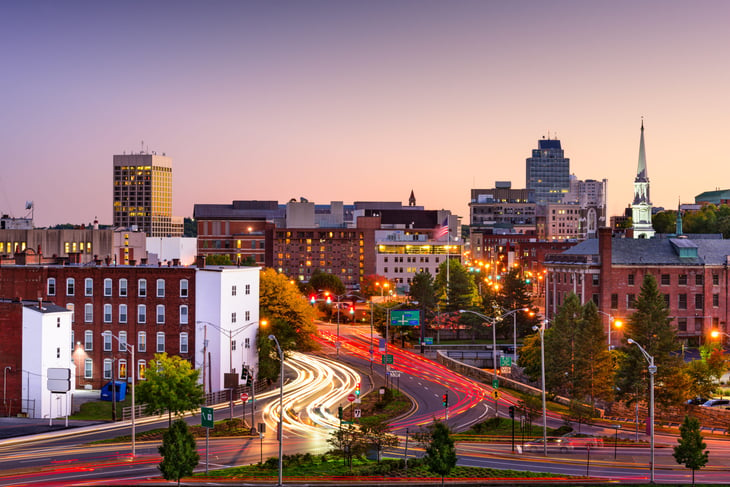
Overall Score: 48.81
Access Rank: 2
Popularity Rank: 38

3. New York, NY
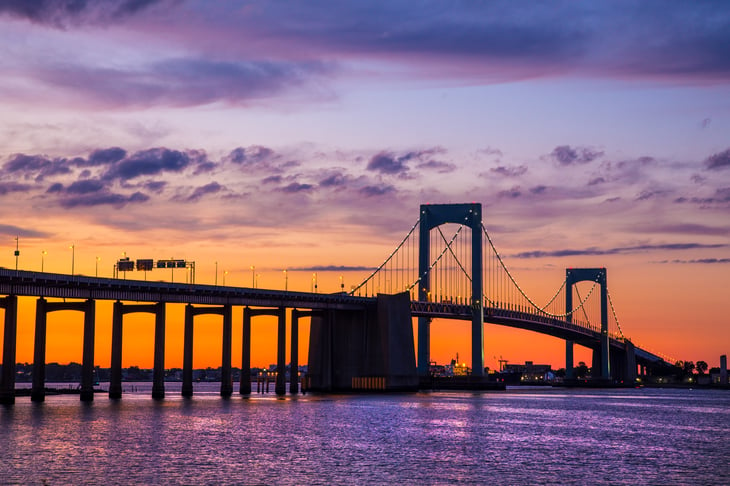
Overall Score: 47.16
Access Rank: 152
Popularity Rank: 1
4. Philadelphia, PA

Overall Score: 41.9
Access Rank: 125
Popularity Rank: 2
5. Jersey City, NJ

Overall Score: 41.35
Access Rank: 106
Popularity Rank: 4
6. Pasadena, CA
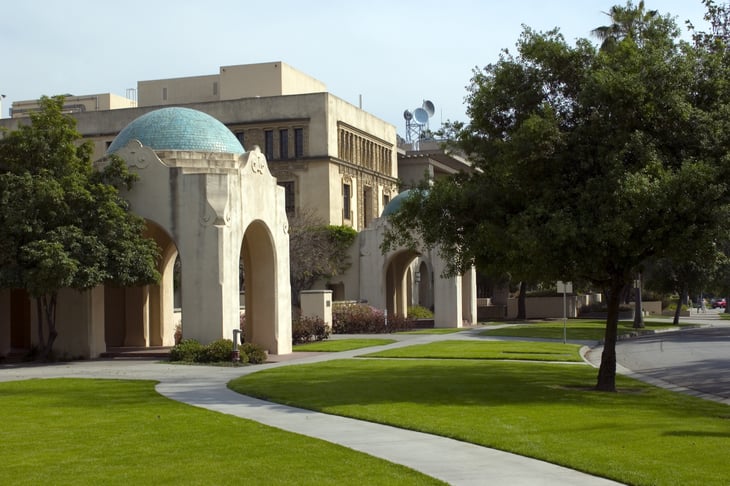
Overall Score: 40.1
Access Rank: 10
Popularity Rank: 33
7. Bridgeport, CT
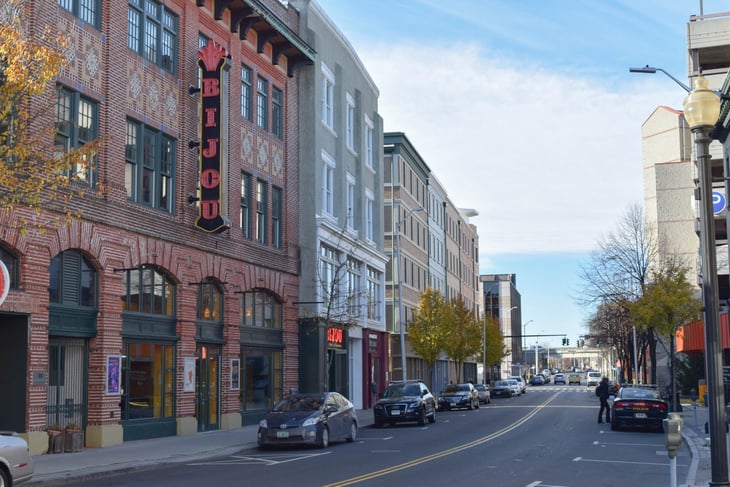
Overall Score: 39.89
Access Rank: 78
Popularity Rank: 7
8. Seattle, WA
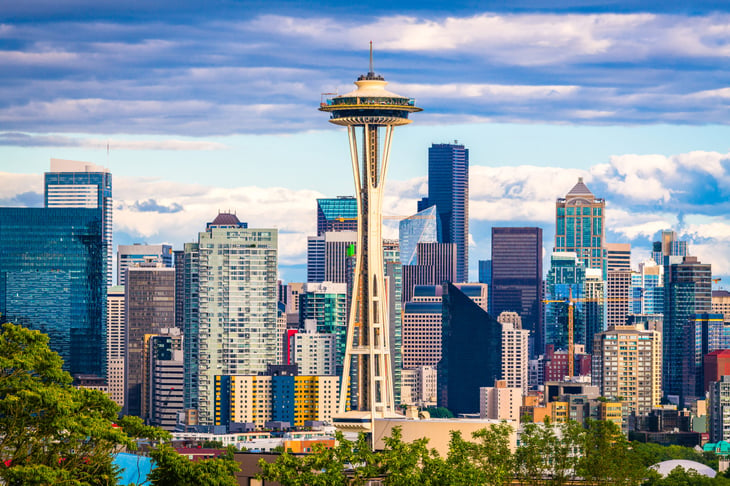
Overall Score: 39.79
Access Rank: 3
Popularity Rank: 103
9. Orlando, FL
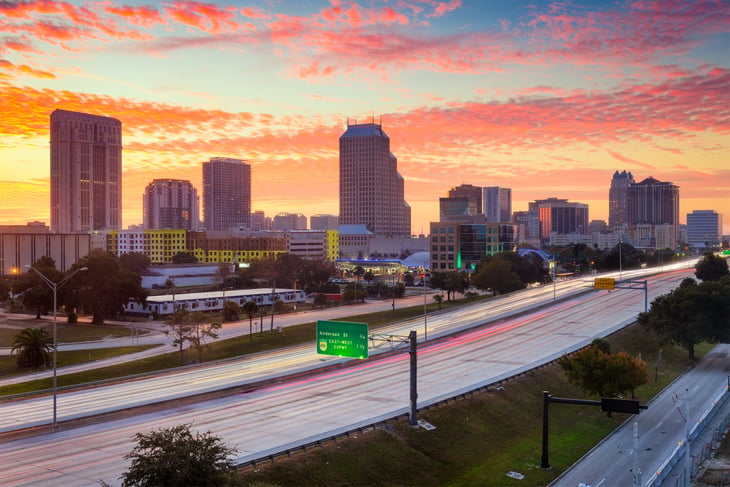
Overall Score: 37.65
Access Rank: 6
Popularity Rank: 57
10. Aurora, IL
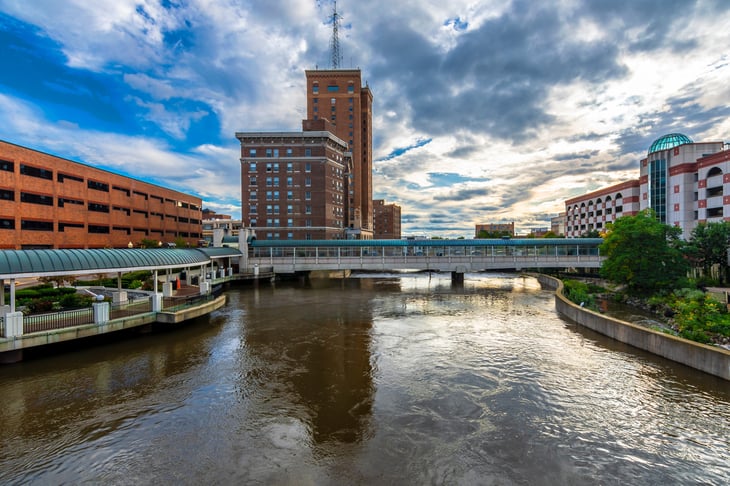
Overall Score: 37.48
Access Rank: 9
Popularity Rank: 49
11. Orange, CA
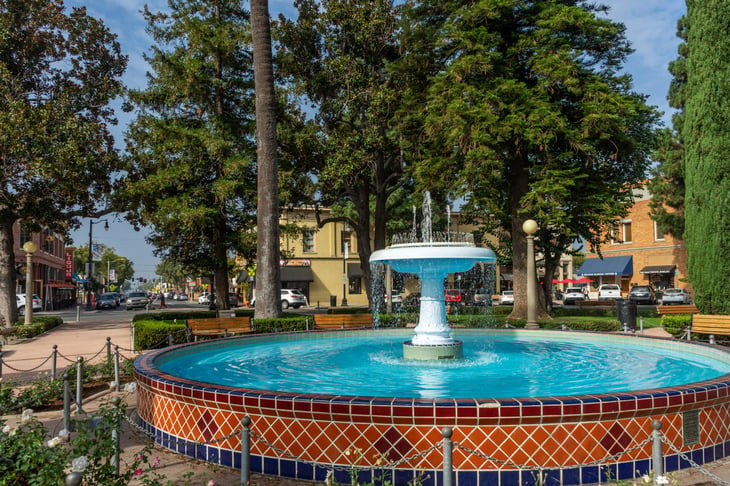
Overall Score: 37.18
Access Rank: 30
Popularity Rank: 17
12. Los Angeles, CA

Overall Score: 37.06
Access Rank: 51
Popularity Rank: 9
13. Oceanside, CA
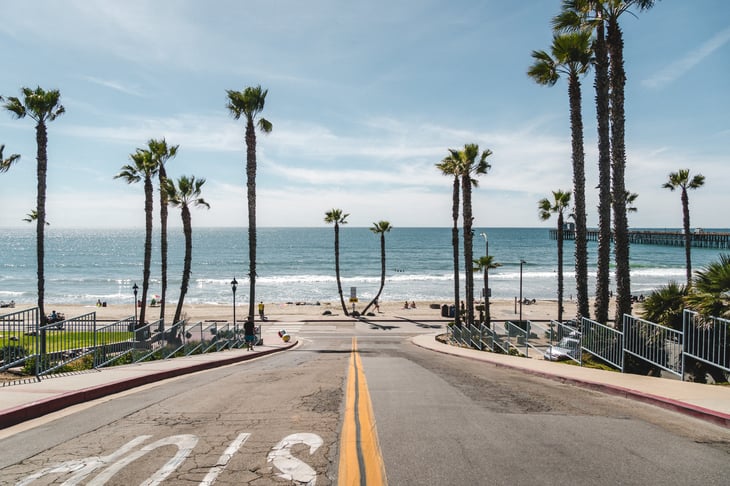
Overall Score: 36.88
Access Rank: 24
Popularity Rank: 25
14. Baltimore, MD
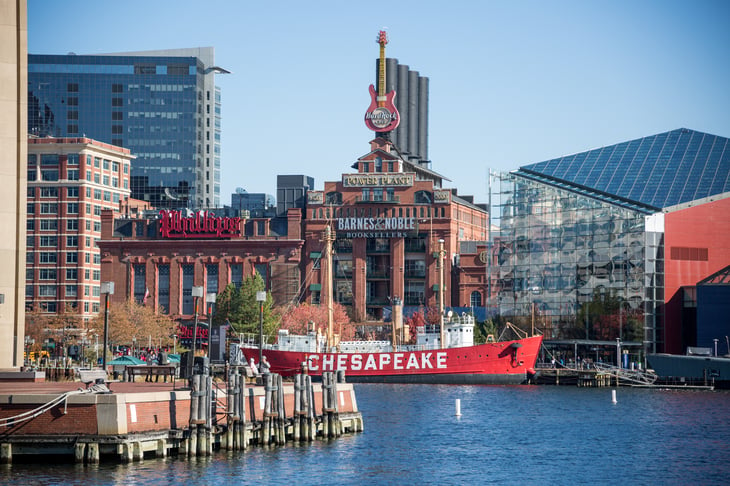
Overall Score: 36.77
Access Rank: 64
Popularity Rank: 8
15. Providence, RI
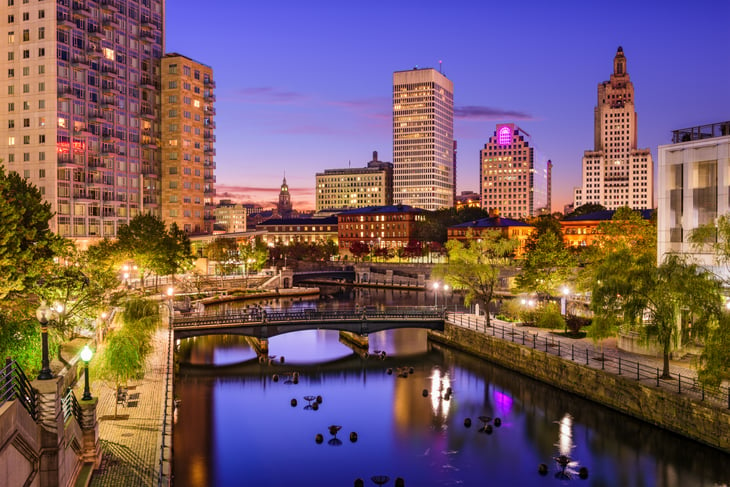
Overall Score: 36.18
Access Rank: 13
Popularity Rank: 39
Methodology

We ranked 197 of the biggest U.S. cities from best (No. 1) to worst (No. 197) based on their overall scores (out of 100 possible points), averaged across all the weighted metrics listed below.
- Number of Pumpkin Patches
- Farmers Markets per 100,000 Residents
- Bakeries per 100,000 Residents
- Coffee Shops per 100,000 Residents
- Average Monthly Google Searches for “Pumpkins” and “Pumpkin Spice” Over Past Month
- Number of Pumpkin Festivals and Events
Sources: East TN Family Fun, Eventbrite, Google Ads, PumpkinPatchesAndMore.org, TripAdvisor, and Yelp.
Add a Comment
Our Policy: We welcome relevant and respectful comments in order to foster healthy and informative discussions. All other comments may be removed. Comments with links are automatically held for moderation.