


Editor's Note: This story originally appeared on LawnStarter.
City living has its advantages, but more people usually means more pollution, more rats, and more trash. The problem is worse in some cities than in others.
LawnStarter ranked 2023’s Dirtiest Cities in America. We compared over 150 of the biggest U.S. cities across four categories, including pollution, living conditions, infrastructure, and consumer satisfaction.
Depending on where you live, you may want to buy some air fresheners, mouse traps, or a can of Raid.
1. Houston, TX
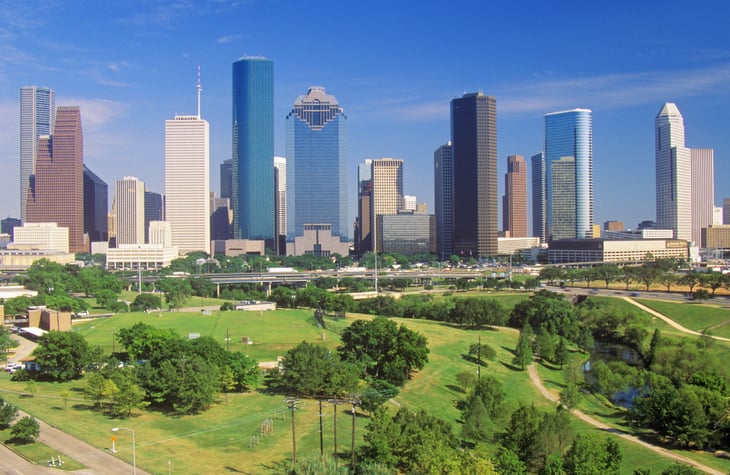
- Overall score: 56.02
- Pollution rank: 3
- Living conditions rank: 4
- Infrastructure rank: 12
- Consumer satisfaction rank: 34
2. Newark, NJ
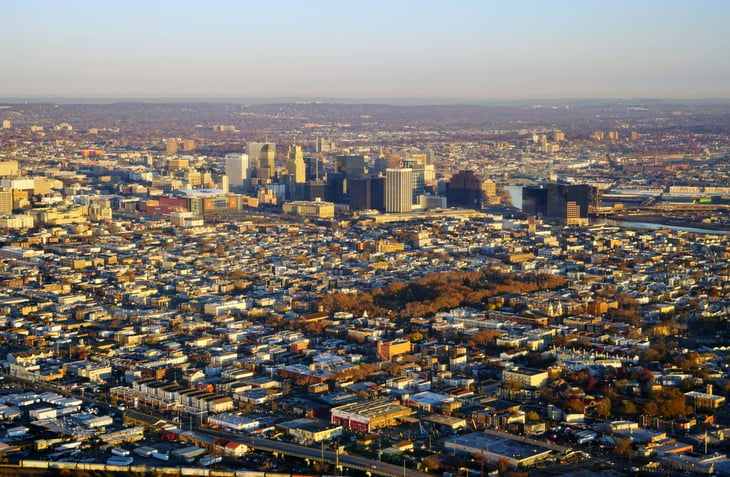
- Overall score: 55.25
- Pollution rank: 14
- Living conditions rank: 5
- Infrastructure rank: 97
- Consumer satisfaction rank: 3
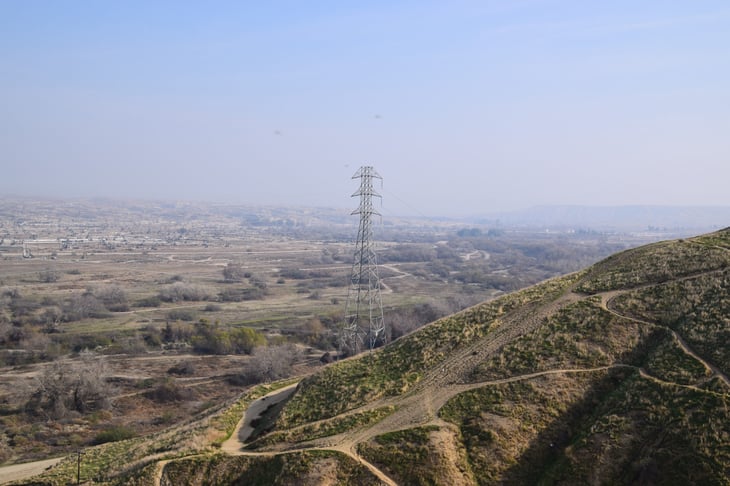
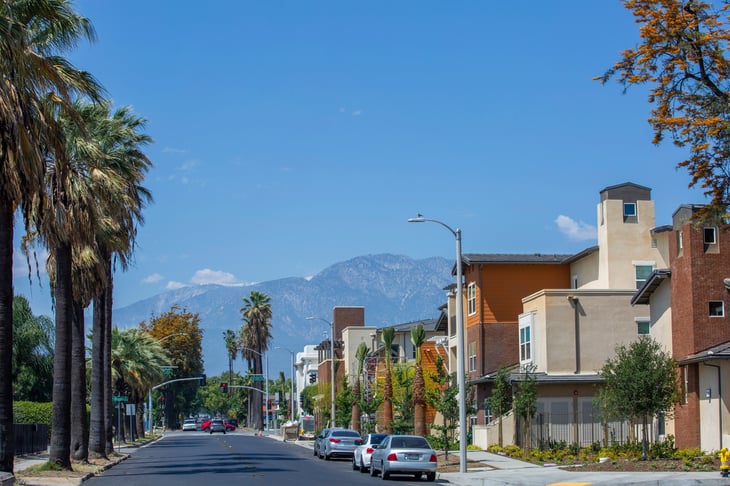
3. San Bernardino, CA
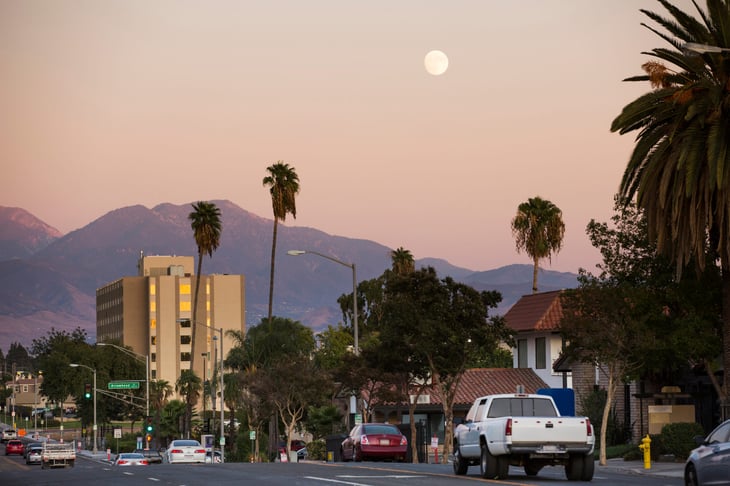
- Overall score: 51.58
- Pollution rank: 1
- Living conditions rank: 56
- Infrastructure rank: 131
- Consumer satisfaction rank: 1

4. Detroit, MI
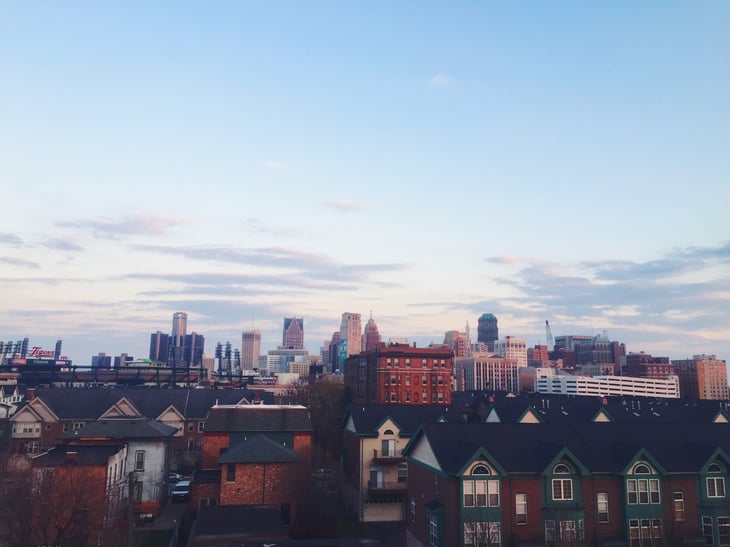
- Overall score: 48.3
- Pollution rank: 9
- Living conditions rank: 35
- Infrastructure rank: 89
- Consumer satisfaction rank: 4
5. Jersey City, NJ
- Overall score: 48.11
- Pollution rank: 50
- Living conditions rank: 2
- Infrastructure rank: 110
- Consumer satisfaction rank: 15
6. Bakersfield, CA
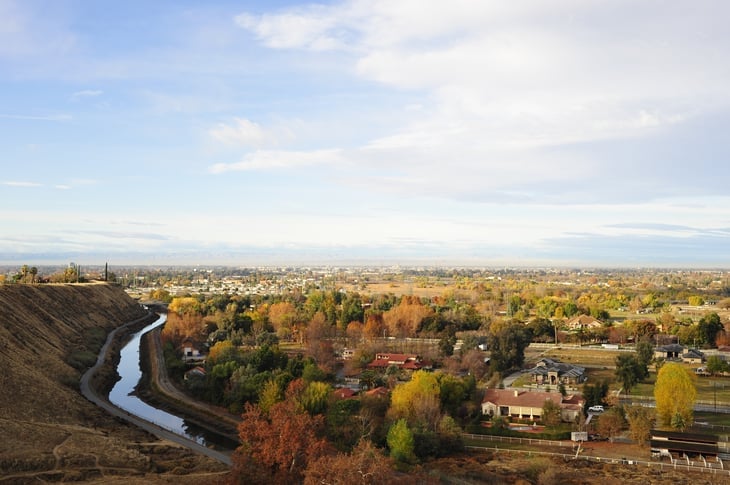
- Overall score: 47.95
- Pollution rank: 27
- Living conditions rank: 69
- Infrastructure rank: 122
- Consumer satisfaction rank: 7
7. San Antonio, TX
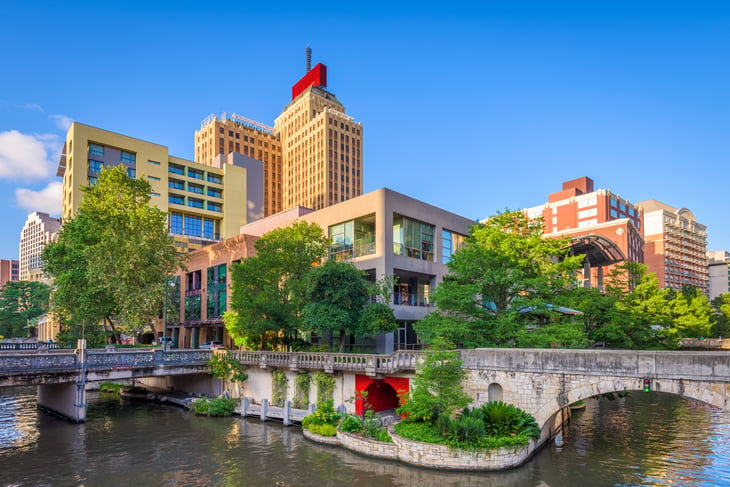
- Overall score: 47.43
- Pollution rank: 34
- Living conditions rank: 12
- Infrastructure rank: 29
- Consumer satisfaction rank: 36
8. Fresno, CA
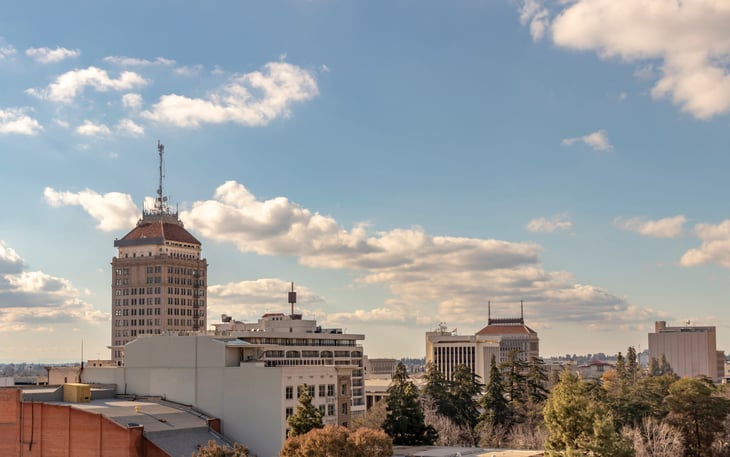
- Overall score: 47.27
- Pollution rank: 31
- Living conditions rank: 81
- Infrastructure rank: 121
- Consumer satisfaction rank: 5
9. Oklahoma City, OK

- Overall score: 46.51
- Pollution rank: 5
- Living conditions rank: 25
- Infrastructure rank: 8
- Consumer satisfaction rank: 96
10. Yonkers, NY
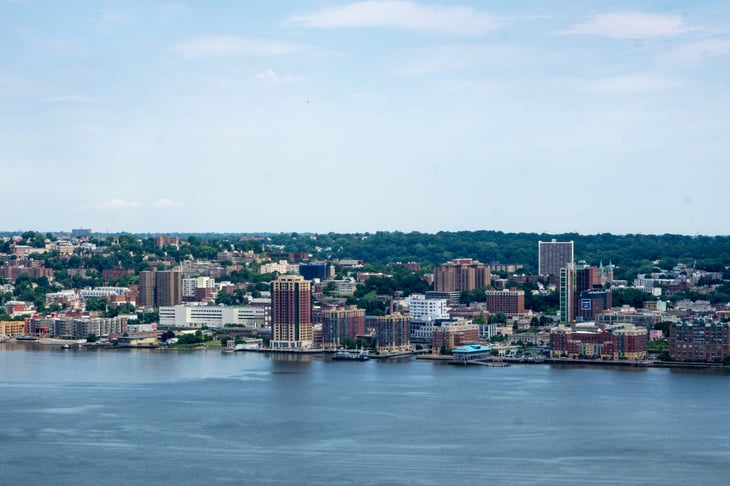
- Overall score: 46.36
- Pollution rank: 46
- Living conditions rank: 8
- Infrastructure rank: 128
- Consumer satisfaction rank: 14
11. Shreveport, LA
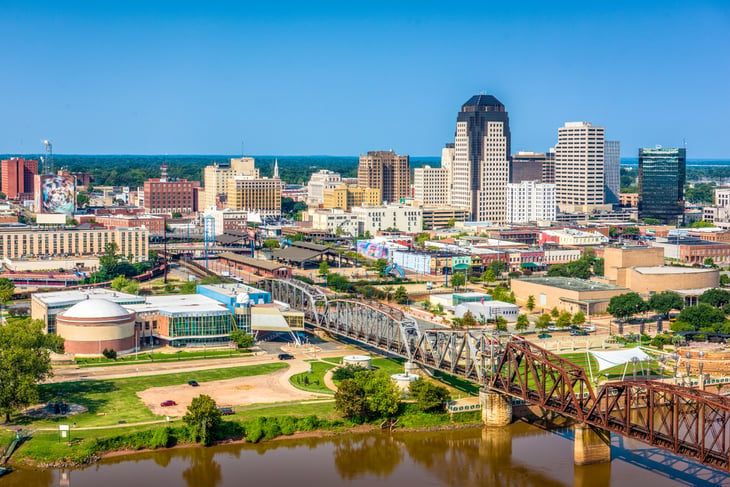
- Overall score: 46.34
- Pollution rank: 26
- Living conditions rank: 86
- Infrastructure rank: 46
- Consumer satisfaction rank: 23
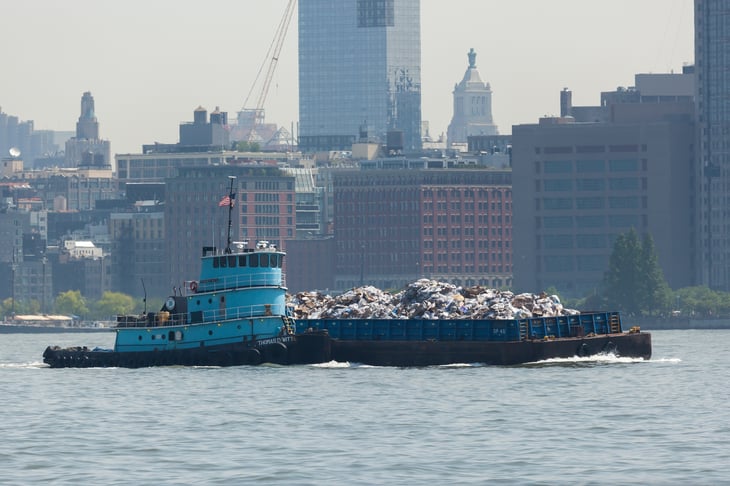
12. New York, NY
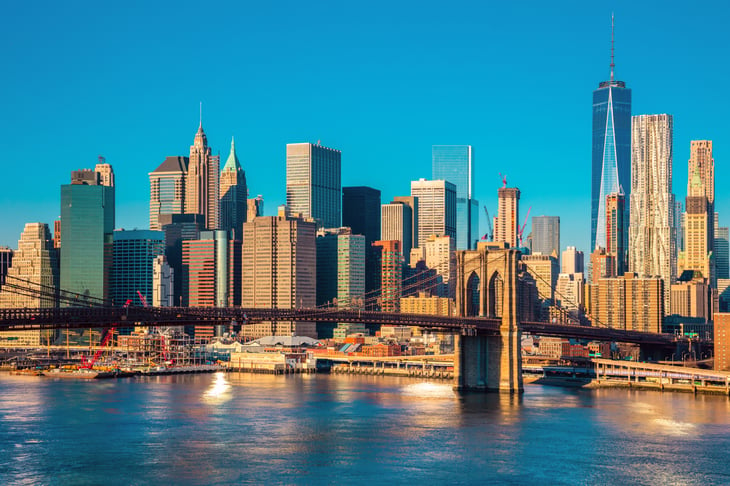
- Overall score: 46.19
- Pollution rank: 102
- Living conditions rank: 1
- Infrastructure rank: 62
- Consumer satisfaction rank: 13
13. Birmingham, AL
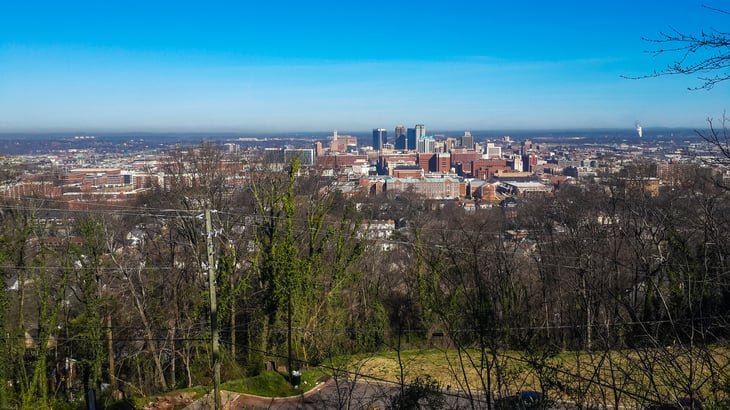
- Overall score: 45.74
- Pollution rank: 94
- Living conditions rank: 3
- Infrastructure rank: 20
- Consumer satisfaction rank: 19
14. Ontario, CA
- Overall score: 45.62
- Pollution rank: 8
- Living conditions rank: 63
- Infrastructure rank: 79
- Consumer satisfaction rank: 10
15. Los Angeles, CA
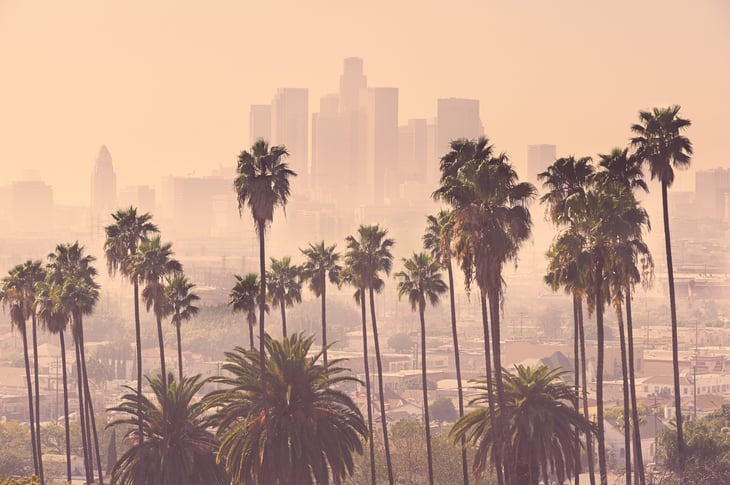
- Overall score: 45.59
- Pollution rank: 30
- Living conditions rank: 29
- Infrastructure rank: 55
- Consumer satisfaction rank: 12
Methodology

For each of the 200 biggest U.S. cities, we gathered publicly available data on the factors listed in the table below.
We then grouped those factors into four categories: Pollution, Living Conditions, Infrastructure, and Consumer Satisfaction.
Next, we calculated weighted scores for each city in each category.
Finally, we averaged the scores for each city across all categories. We eliminated 48 cities lacking sufficient data for a fair comparison, resulting in a final sample size of 152 cities.
The city that earned the highest average score was ranked “Dirtiest” (No. 1).
Add a Comment
Our Policy: We welcome relevant and respectful comments in order to foster healthy and informative discussions. All other comments may be removed. Comments with links are automatically held for moderation.