


Editor's Note: This story originally appeared on CLIQ.
While cycling has grown in popularity in recent years, it has especially boomed during the COVID-19 pandemic as people turned to the outdoors to exercise and looked for alternatives to public transportation. However, even before the pandemic hit, cycling was becoming more dangerous. According to the National Highway Traffic Safety Administration, cycling traffic fatalities increased by 35% from 2009 to 2019. Cities with bad traffic and less bike-friendly infrastructure are particularly dangerous for cyclists.
After decreasing for a number of years, cyclist traffic fatalities have been trending upward since 2010. When considering bicycle fatalities as a share of all vehicle fatalities, the percentage has also been increasing. In 2005, bike fatalities made up 1.8% of all vehicle fatalities; in 2019, that figure had risen to 2.3%, when 846 cyclists were killed in traffic accidents. The increase in cyclist deaths is likely due to a number of factors — worsening traffic, more drivers distracted by smartphones, and an increase in the number of cyclists on the road.
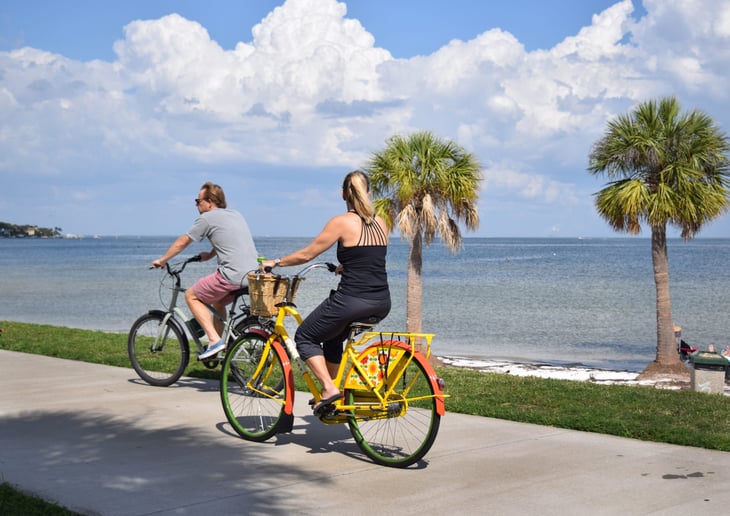
More cyclists on the road tends to mean more cyclist traffic deaths. In warmer parts of the country, where people can ride outside for longer portions of the year, cyclist deaths are more common. Between 2015 and 2019, Florida and Louisiana reported the most cyclist fatalities per capita, at 7.0 and 5.6 annual cyclist fatalities per 1 million residents, respectively. Looking at total cyclist fatalities, Florida, California, and Texas were responsible for 42% of deaths despite accounting for just 27% of the total U.S. population.
To find the cities with the most cyclist traffic fatalities, researchers at CLIQ analyzed the latest data from the National Highway Traffic Safety Administration and the U.S. Census Bureau. The researchers ranked cities according to the number of annual cyclist fatalities per capita, averaged over the period of 2015–2019. Researchers also calculated the annual cyclist fatalities per capita compared to average, total cyclist fatalities, cyclist fatalities as a share of total vehicle fatalities, and the share of workers that commute by bike. Researchers only considered the top 100 most populous cities with data on cyclist fatalities in the analysis.
The following are the cities from that group that are the most dangerous places for cyclists.
15. St. Petersburg, FL
- Annual cyclist fatalities per 1 million residents: 5.3
- Annual cyclist fatalities per 1 million (compared to average): +105%
- Total cyclist fatalities (2015–2019): 7
- Cyclist fatalities as a share of total vehicle fatalities: 5.4%
- Share of workers that commute by bike: 0.9%
14. Bakersfield, CA

- Annual cyclist fatalities per 1 million residents: 5.3
- Annual cyclist fatalities per 1 million (compared to average): +105%
- Total cyclist fatalities (2015–2019): 10
- Cyclist fatalities as a share of total vehicle fatalities: 5.1%
- Share of workers that commute by bike: 0.2%

13. Santa Ana, CA

- Annual cyclist fatalities per 1 million residents: 5.4
- Annual cyclist fatalities per 1 million (compared to average): +109%
- Total cyclist fatalities (2015–2019): 9
- Cyclist fatalities as a share of total vehicle fatalities: 8.4%
- Share of workers that commute by bike: 0.8%
12. Spokane, WA

- Annual cyclist fatalities per 1 million residents: 5.5
- Annual cyclist fatalities per 1 million (compared to average): +113%
- Total cyclist fatalities (2015–2019): 6
- Cyclist fatalities as a share of total vehicle fatalities: 12.5%
- Share of workers that commute by bike: 0.5%
11. San Bernardino, CA

- Annual cyclist fatalities per 1 million residents: 6.5
- Annual cyclist fatalities per 1 million (compared to average): +151%
- Total cyclist fatalities (2015–2019): 7
- Cyclist fatalities as a share of total vehicle fatalities: 6.4%
- Share of workers that commute by bike: 0.0%
10. Tucson, AZ

- Annual cyclist fatalities per 1 million residents: 6.7
- Annual cyclist fatalities per 1 million (compared to average): +159%
- Total cyclist fatalities (2015–2019): 18
- Cyclist fatalities as a share of total vehicle fatalities: 4.8%
- Share of workers that commute by bike: 2.3%
9. Albuquerque, NM

- Annual cyclist fatalities per 1 million residents: 6.8
- Annual cyclist fatalities per 1 million (compared to average): +163%
- Total cyclist fatalities (2015–2019): 19
- Cyclist fatalities as a share of total vehicle fatalities: 4.5%
- Share of workers that commute by bike: 1.1%
8. Jacksonville, FL

- Annual cyclist fatalities per 1 million residents: 7.2
- Annual cyclist fatalities per 1 million (compared to average): +178%
- Total cyclist fatalities (2015–2019): 32
- Cyclist fatalities as a share of total vehicle fatalities: 4.5%
- Share of workers that commute by bike: 0.3%
7. Modesto, CA

- Annual cyclist fatalities per 1 million residents: 7.5
- Annual cyclist fatalities per 1 million (compared to average): +190%
- Total cyclist fatalities (2015–2019): 8
- Cyclist fatalities as a share of total vehicle fatalities: 8.2%
- Share of workers that commute by bike: 0.2%
6. Miami, FL

- Annual cyclist fatalities per 1 million residents: 7.8
- Annual cyclist fatalities per 1 million (compared to average): +202%
- Total cyclist fatalities (2015–2019): 18
- Cyclist fatalities as a share of total vehicle fatalities: 6.6%
- Share of workers that commute by bike: 0.5%
5. New Orleans, LA
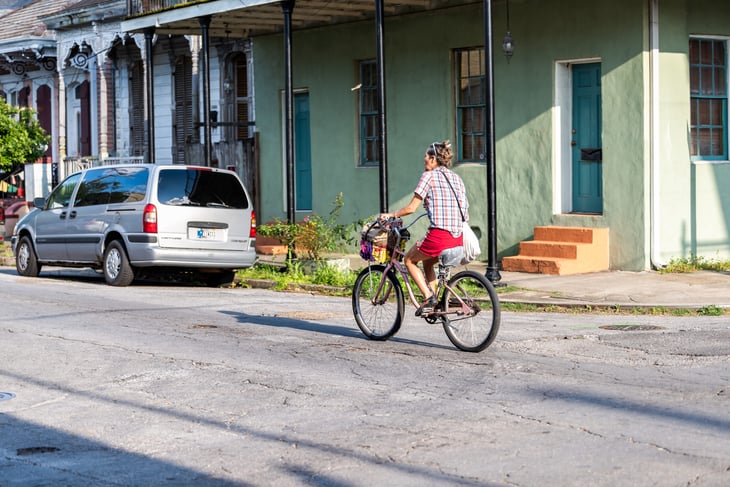
- Annual cyclist fatalities per 1 million residents: 8.7
- Annual cyclist fatalities per 1 million (compared to average): +236%
- Total cyclist fatalities (2015–2019): 17
- Cyclist fatalities as a share of total vehicle fatalities: 8.8%
- Share of workers that commute by bike: 2.6%
4. Sacramento, CA

- Annual cyclist fatalities per 1 million residents: 10.4
- Annual cyclist fatalities per 1 million (compared to average): +302%
- Total cyclist fatalities (2015–2019): 26
- Cyclist fatalities as a share of total vehicle fatalities: 9.6%
- Share of workers that commute by bike: 1.6%
3. Tampa, FL

- Annual cyclist fatalities per 1 million residents: 10.9
- Annual cyclist fatalities per 1 million (compared to average): +321%
- Total cyclist fatalities (2015–2019): 21
- Cyclist fatalities as a share of total vehicle fatalities: 7.7%
- Share of workers that commute by bike: 0.7%
2. Baton Rouge, LA
- Annual cyclist fatalities per 1 million residents: 14.2
- Annual cyclist fatalities per 1 million (compared to average): +449%
- Total cyclist fatalities (2015–2019): 16
- Cyclist fatalities as a share of total vehicle fatalities: 7.2%
- Share of workers that commute by bike: 0.4%

1. Stockton, CA

- Annual cyclist fatalities per 1 million residents: 14.9
- Annual cyclist fatalities per 1 million (compared to average): +476%
- Total cyclist fatalities (2015–2019): 23
- Cyclist fatalities as a share of total vehicle fatalities: 13.8%
- Share of workers that commute by bike: 0.1%
Detailed Findings & Methodology

The most dangerous cities for cyclists are mostly warm-weather locales in California, Florida, and the South. On a per-capita basis, these cities have much higher rates of cyclist fatalities compared with the national rate of 2.6 cyclist traffic fatalities per 1 million people, ranging from over twice as many to more than 6-fold the national rate. While Stockton, California, reported the most per-capita cyclist fatalities (at 14.9 per 1 million people), Los Angeles and New York reported the most overall between 2015 and 2019, at 89 and 87 fatalities respectively. Nationally, cyclist traffic fatalities represent 2.3% of total vehicle fatalities. In the most dangerous large cities for cyclists, cyclist fatalities make up a much larger proportion of vehicle fatalities, accounting for over 10% in certain cities.
To find the locations with the most cyclist traffic fatalities, researchers at CLIQ analyzed the latest data from the National Highway Traffic Safety Administration’s Fatality Analysis Reporting System and the U.S. Census Bureau’s American Community Survey. The researchers ranked cities according to the number of annual cyclist fatalities per 1 million residents, averaged over the years 2015 to 2019. In the event of a tie, the city with the larger number of total cyclist fatalities from 2015 to 2019 was ranked higher. Researchers also calculated the annual cyclist fatalities per 1 million residents compared to the national average, cyclist fatalities as a share of total vehicle fatalities, and the share of workers that commute by bike.
Only the 100 most populous cities with data on cyclist fatalities were included in the analysis.
Add a Comment
Our Policy: We welcome relevant and respectful comments in order to foster healthy and informative discussions. All other comments may be removed. Comments with links are automatically held for moderation.