
Editor's Note: This story originally appeared on Upgraded Points.
Halloween is on its way. Scary movies, spooky costumes, and pumpkin carving are all time-honored Halloween traditions, but trick-or-treating — and the accompanying appetite for candy — is perhaps the season’s most distinguishing feature.
Recent research from the National Retail Federation found that handing out candy is the most common way consumers celebrate the holiday, with more than two-thirds of households planning to do so in 2023.
And despite a steep rise in candy prices over the past two years, the demand for Halloween candy in the U.S. shows no sign of waning. Americans are projected to spend a substantial $3.6 billion this year to stock up on their Halloween treats.
With such a major economic impact, Halloween stands as one of the primary drivers of candy sales in the U.S.
However, the country’s candy production industry plays a role that extends far beyond a single holiday, exerting a noteworthy influence on the economies of various states and localities. In these designated “candy capitals,” confectionery production and retail account for a disproportionate number of local jobs and businesses.
To determine which local economies are most reliant on the candy industry, our researchers created a composite score that factored in the concentration of employment, payroll, and locations of candy producers and candy retail stores compared to the national average. Here are the candy capitals of the U.S.
1. Burlington-South Burlington, VT
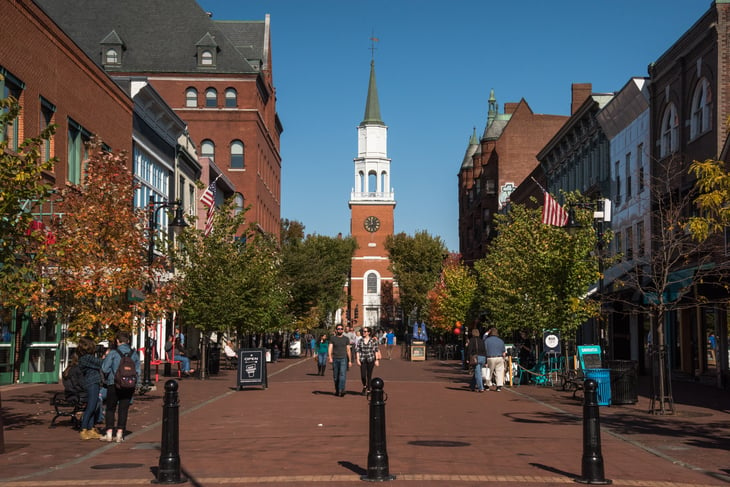
- Composite Score: 95.83
- Concentration of Candy Industry Employment (Compared to Average): 8.9x
- Concentration of Candy Industry Payroll (Compared to Average): 8.3x
- Concentration of Candy Businesses (Compared to Average): 3.5x
2. Santa Cruz-Watsonville, CA

- Composite Score: 95.13
- Concentration of Candy Industry Employment (Compared to Average): 11.1x
- Concentration of Candy Industry Payroll (Compared to Average): 17.9x
- Concentration of Candy Businesses (Compared to Average): 2.3x
3. Vallejo-Fairfield, CA

- Composite Score: 94.60
- Concentration of Candy Industry Employment (Compared to Average): 8.0x
- Concentration of Candy Industry Payroll (Compared to Average): 10.9x
- Concentration of Candy Businesses (Compared to Average): 2.8x
4. Scranton–Wilkes-Barre–Hazleton, PA

- Composite Score: 94.37
- Concentration of Candy Industry Employment (Compared to Average): 7.0x
- Concentration of Candy Industry Payroll (Compared to Average): 9.4x
- Concentration of Candy Businesses (Compared to Average): 3.2x
5. Ocean City, NJ

- Composite Score: 93.87
- Concentration of Candy Industry Employment (Compared to Average): 5.2x
- Concentration of Candy Industry Payroll (Compared to Average): 7.1x
- Concentration of Candy Businesses (Compared to Average): 10.2x
6. Altoona, PA
- Composite Score: 93.37
- Concentration of Candy Industry Employment (Compared to Average): 5.5x
- Concentration of Candy Industry Payroll (Compared to Average): 5.9x
- Concentration of Candy Businesses (Compared to Average): 3.6x
7. Lancaster, PA

- Composite Score: 92.67
- Concentration of Candy Industry Employment (Compared to Average): 6.3x
- Concentration of Candy Industry Payroll (Compared to Average): 9.4x
- Concentration of Candy Businesses (Compared to Average): 2.4x
8. Grand Forks, ND-MN

- Composite Score: 92.40
- Concentration of Candy Industry Employment (Compared to Average): 24.8x
- Concentration of Candy Industry Payroll (Compared to Average): 37.5x
- Concentration of Candy Businesses (Compared to Average): 1.8x
9. Reading, PA

- Composite Score: 92.17
- Concentration of Candy Industry Employment (Compared to Average): 7.0x
- Concentration of Candy Industry Payroll (Compared to Average): 9.1x
- Concentration of Candy Businesses (Compared to Average): 2.3x
10. Harrisburg-Carlisle, PA

- Composite Score: 89.47
- Concentration of Candy Industry Employment (Compared to Average): 9.8x
- Concentration of Candy Industry Payroll (Compared to Average): 15.1x
- Concentration of Candy Businesses (Compared to Average): 1.6x
11. Napa, CA

- Composite Score: 88.50
- Concentration of Candy Industry Employment (Compared to Average): 3.7x
- Concentration of Candy Industry Payroll (Compared to Average): 3.7x
- Concentration of Candy Businesses (Compared to Average): 2.9x
12. Rockford, IL
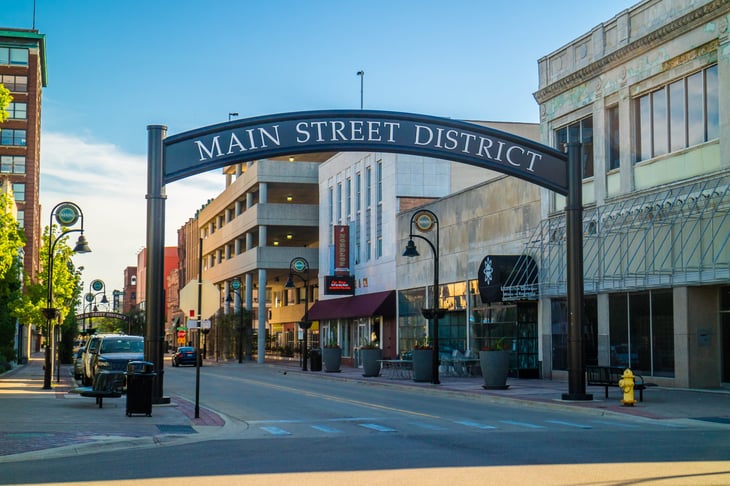
- Composite Score: 85.80
- Concentration of Candy Industry Employment (Compared to Average): 9.2x
- Concentration of Candy Industry Payroll (Compared to Average): 16.1x
- Concentration of Candy Businesses (Compared to Average): 1.4x
13. Salisbury, MD-DE
- Composite Score: 85.30
- Concentration of Candy Industry Employment (Compared to Average): 2.1x
- Concentration of Candy Industry Payroll (Compared to Average): 2.3x
- Concentration of Candy Businesses (Compared to Average): 4.1x
14. Billings, MT

- Composite Score: 84.30
- Concentration of Candy Industry Employment (Compared to Average): 2.6x
- Concentration of Candy Industry Payroll (Compared to Average): 3.4x
- Concentration of Candy Businesses (Compared to Average): 2.3x
15. Savannah, GA

- Composite Score: 83.33
- Concentration of Candy Industry Employment (Compared to Average): 3.5x
- Concentration of Candy Industry Payroll (Compared to Average): 5.7x
- Concentration of Candy Businesses (Compared to Average): 1.8x
Methodology

The data used in this analysis is from the U.S. Census Bureau’s County Business Patterns survey, which includes statistical estimates for U.S. businesses with employees.
To determine the candy capitals of the U.S., researchers at Upgraded Points created a composite score for each location based on the concentrations of employment, payroll, and establishments in the candy industry relative to the national averages.
Both “Sugar and confectionery product manufacturing” businesses and “Confectionery and nut stores” were considered. Additionally, only locations with positive values across the resulting metrics were included.


Add a Comment
Our Policy: We welcome relevant and respectful comments in order to foster healthy and informative discussions. All other comments may be removed. Comments with links are automatically held for moderation.