


Editor's Note: This story originally appeared on Trace One.
For decades, the Supplemental Nutrition Assistance Program (SNAP), formerly referred to as food stamps, has been one of the most significant social welfare programs in the United States, helping millions of Americans afford basic nutrition.
As a federally funded program, SNAP has been a focal point of debate for both major political parties, often framed as either a critical tool in reducing poverty and food insecurity or a costly government expense in need of reform.
Unlike many partisan issues, however, changes to SNAP have not always followed clear party lines. Both Republican and Democratic administrations have expanded and contracted the program at different times, reflecting a complex balance between fiscal and social responsibility.
More recently, the current Trump administration and Republican lawmakers have signaled their intent to scale back SNAP benefits, arguing for stronger work requirements, limits on the purchase of certain foods, and budget reductions.
Amid this evolving policy landscape, Trace One — a company specializing in regulatory compliance for the food and beverage industry — examined the latest data from the USDA and Census Bureau to find the states that rely most heavily on SNAP benefits. Find the detailed methodology at the end.
Here are the states that depend the most on food assistance.
20. Arizona

- Share of individuals receiving SNAP benefits: 12.4%
- Share of households receiving SNAP benefits: 15.6%
- Average monthly SNAP benefit per individual: $182
- Average monthly SNAP benefit per household: $370
- Individuals receiving SNAP benefits: 923,400
- Households receiving SNAP benefits: 454,029
- Annual SNAP benefits received: $2,015,194,104
- Poverty rate: 12.4%
- Population: 7,431,344
- Households: 2,907,014
19. Georgia

- Share of individuals receiving SNAP benefits: 12.8%
- Share of households receiving SNAP benefits: 16.5%
- Average monthly SNAP benefit per individual: $193
- Average monthly SNAP benefit per household: $399
- Individuals receiving SNAP benefits: 1,411,357
- Households receiving SNAP benefits: 683,123
- Annual SNAP benefits received: $3,269,318,111
- Poverty rate: 13.6%
- Population: 11,029,227
- Households: 4,150,138
18. North Carolina

- Share of individuals receiving SNAP benefits: 13.1%
- Share of households receiving SNAP benefits: 16.1%
- Average monthly SNAP benefit per individual: $173
- Average monthly SNAP benefit per household: $347
- Individuals receiving SNAP benefits: 1,415,607
- Households receiving SNAP benefits: 705,967
- Annual SNAP benefits received: $2,939,826,574
- Poverty rate: 12.8%
- Population: 10,835,491
- Households: 4,392,669
17. Mississippi

- Share of individuals receiving SNAP benefits: 13.1%
- Share of households receiving SNAP benefits: 16.4%
- Average monthly SNAP benefit per individual: $182
- Average monthly SNAP benefit per household: $366
- Individuals receiving SNAP benefits: 384,805
- Households receiving SNAP benefits: 191,549
- Annual SNAP benefits received: $842,267,063
- Poverty rate: 18.0%
- Population: 2,939,690
- Households: 1,166,617
16. Kentucky

- Share of individuals receiving SNAP benefits: 13.2%
- Share of households receiving SNAP benefits: 14.9%
- Average monthly SNAP benefit per individual: $161
- Average monthly SNAP benefit per household: $347
- Individuals receiving SNAP benefits: 595,220
- Households receiving SNAP benefits: 276,406
- Annual SNAP benefits received: $1,152,314,047
- Poverty rate: 16.4%
- Population: 4,526,154
- Households: 1,853,603
15. Rhode Island

- Share of individuals receiving SNAP benefits: 13.2%
- Share of households receiving SNAP benefits: 20.3%
- Average monthly SNAP benefit per individual: $199
- Average monthly SNAP benefit per household: $318
- Individuals receiving SNAP benefits: 144,187
- Households receiving SNAP benefits: 90,064
- Annual SNAP benefits received: $343,484,292
- Poverty rate: 10.8%
- Population: 1,095,962
- Households: 443,980
14. Florida

- Share of individuals receiving SNAP benefits: 13.2%
- Share of households receiving SNAP benefits: 18.4%
- Average monthly SNAP benefit per individual: $185
- Average monthly SNAP benefit per household: $333
- Individuals receiving SNAP benefits: 2,975,789
- Households receiving SNAP benefits: 1,651,470
- Annual SNAP benefits received: $6,604,797,454
- Poverty rate: 12.3%
- Population: 22,610,726
- Households: 8,966,402
13. California

- Share of individuals receiving SNAP benefits: 13.8%
- Share of households receiving SNAP benefits: 22.8%
- Average monthly SNAP benefit per individual: $192
- Average monthly SNAP benefit per household: $330
- Individuals receiving SNAP benefits: 5,379,575
- Households receiving SNAP benefits: 3,128,640
- Annual SNAP benefits received: $12,377,175,489
- Poverty rate: 12.0%
- Population: 38,965,193
- Households: 13,699,816
12. Michigan

- Share of individuals receiving SNAP benefits: 14.7%
- Share of households receiving SNAP benefits: 19.1%
- Average monthly SNAP benefit per individual: $173
- Average monthly SNAP benefit per household: $325
- Individuals receiving SNAP benefits: 1,474,427
- Households receiving SNAP benefits: 785,222
- Annual SNAP benefits received: $3,061,361,572
- Poverty rate: 13.5%
- Population: 10,037,261
- Households: 4,107,809
11. Alabama

- Share of individuals receiving SNAP benefits: 14.7%
- Share of households receiving SNAP benefits: 18.3%
- Average monthly SNAP benefit per individual: $192
- Average monthly SNAP benefit per household: $384
- Individuals receiving SNAP benefits: 752,161
- Households receiving SNAP benefits: 376,039
- Annual SNAP benefits received: $1,733,693,703
- Poverty rate: 15.6%
- Population: 5,108,468
- Households: 2,051,545
10. New York

- Share of individuals receiving SNAP benefits: 15.0%
- Share of households receiving SNAP benefits: 21.9%
- Average monthly SNAP benefit per individual: $209
- Average monthly SNAP benefit per household: $359
- Individuals receiving SNAP benefits: 2,926,213
- Households receiving SNAP benefits: 1,707,771
- Annual SNAP benefits received: $7,353,983,677
- Poverty rate: 14.2%
- Population: 19,571,216
- Households: 7,809,267
9. Illinois

- Share of individuals receiving SNAP benefits: 15.4%
- Share of households receiving SNAP benefits: 20.9%
- Average monthly SNAP benefit per individual: $192
- Average monthly SNAP benefit per household: $351
- Individuals receiving SNAP benefits: 1,935,645
- Households receiving SNAP benefits: 1,061,257
- Annual SNAP benefits received: $4,469,341,818
- Poverty rate: 11.6%
- Population: 12,549,689
- Households: 5,071,288

8. Pennsylvania

- Share of individuals receiving SNAP benefits: 15.4%
- Share of households receiving SNAP benefits: 20.3%
- Average monthly SNAP benefit per individual: $178
- Average monthly SNAP benefit per household: $329
- Individuals receiving SNAP benefits: 2,000,018
- Households receiving SNAP benefits: 1,079,939
- Annual SNAP benefits received: $4,268,081,855
- Poverty rate: 12.0%
- Population: 12,961,683
- Households: 5,324,209
7. West Virginia

- Share of individuals receiving SNAP benefits: 15.7%
- Share of households receiving SNAP benefits: 19.9%
- Average monthly SNAP benefit per individual: $170
- Average monthly SNAP benefit per household: $319
- Individuals receiving SNAP benefits: 277,429
- Households receiving SNAP benefits: 147,957
- Annual SNAP benefits received: $565,647,589
- Poverty rate: 16.7%
- Population: 1,770,071
- Households: 743,644
6. Nevada

- Share of individuals receiving SNAP benefits: 15.8%
- Share of households receiving SNAP benefits: 22.0%
- Average monthly SNAP benefit per individual: $166
- Average monthly SNAP benefit per household: $311
- Individuals receiving SNAP benefits: 505,462
- Households receiving SNAP benefits: 269,676
- Annual SNAP benefits received: $1,006,689,627
- Poverty rate: 12.0%
- Population: 3,194,176
- Households: 1,224,685
5. Massachusetts

- Share of individuals receiving SNAP benefits: 15.9%
- Share of households receiving SNAP benefits: 24.2%
- Average monthly SNAP benefit per individual: $196
- Average monthly SNAP benefit per household: $321
- Individuals receiving SNAP benefits: 1,113,678
- Households receiving SNAP benefits: 678,728
- Annual SNAP benefits received: $2,617,666,701
- Poverty rate: 10.4%
- Population: 7,001,399
- Households: 2,800,984
4. Oklahoma

- Share of individuals receiving SNAP benefits: 16.9%
- Share of households receiving SNAP benefits: 21.0%
- Average monthly SNAP benefit per individual: $183
- Average monthly SNAP benefit per household: $375
- Individuals receiving SNAP benefits: 686,808
- Households receiving SNAP benefits: 334,471
- Annual SNAP benefits received: $1,506,222,914
- Poverty rate: 15.9%
- Population: 4,053,824
- Households: 1,589,105
3. Oregon

- Share of individuals receiving SNAP benefits: 17.9%
- Share of households receiving SNAP benefits: 24.9%
- Average monthly SNAP benefit per individual: $176
- Average monthly SNAP benefit per household: $305
- Individuals receiving SNAP benefits: 757,744
- Households receiving SNAP benefits: 435,627
- Annual SNAP benefits received: $1,596,585,242
- Poverty rate: 12.2%
- Population: 4,233,358
- Households: 1,752,050
2. Louisiana

- Share of individuals receiving SNAP benefits: 18.5%
- Share of households receiving SNAP benefits: 22.8%
- Average monthly SNAP benefit per individual: $187
- Average monthly SNAP benefit per household: $380
- Individuals receiving SNAP benefits: 847,133
- Households receiving SNAP benefits: 417,696
- Annual SNAP benefits received: $1,902,467,840
- Poverty rate: 18.9%
- Population: 4,573,749
- Households: 1,833,915
1. New Mexico
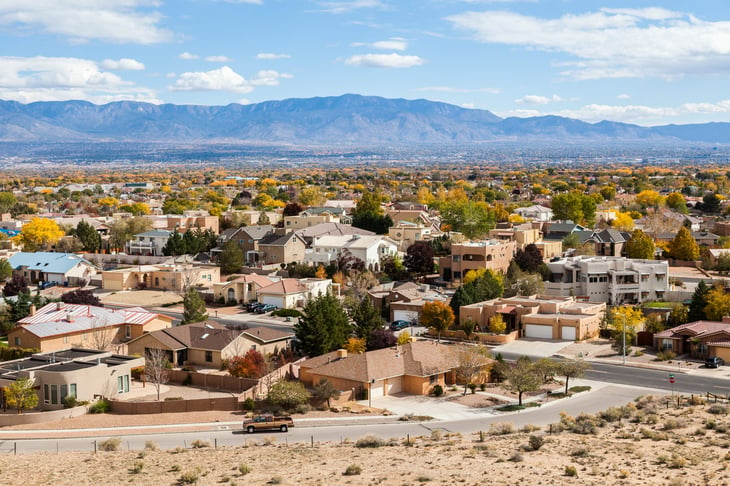
- Share of individuals receiving SNAP benefits: 21.3%
- Share of households receiving SNAP benefits: 28.2%
- Average monthly SNAP benefit per individual: $190
- Average monthly SNAP benefit per household: $354
- Individuals receiving SNAP benefits: 451,243
- Households receiving SNAP benefits: 241,689
- Annual SNAP benefits received: $1,028,090,754
- Poverty rate: 17.8%
- Population: 2,114,371
- Households: 856,580
Methodology

This analysis examines food assistance dependence across U.S. states by evaluating SNAP participation and benefits.
Data sources include the U.S. Department of Agriculture (USDA) Food and Nutrition Service (FNS) SNAP Data Tables, the U.S. Census Bureau American Community Survey (ACS) 1-Year Estimates, the U.S. Census Bureau Families and Living Arrangements, and the U.S. Bureau of Economic Analysis Personal Income and Outlays.
To assess SNAP dependence, researchers at Trace One calculated the percentage of each state’s total population receiving SNAP benefits, as well as the percentage of households participating in the program during fiscal year 2024. These figures are based on USDA-reported average monthly participation over the course of the year.
Researchers also calculated the average monthly SNAP benefit per participating individual and household, along with the total annual SNAP benefits distributed in each state during the year.
State-level economic conditions were considered by incorporating poverty rate statistics from the 2023 ACS. State-level population and household estimates are from 2023, the most recent available data, while national-level estimates were based on 2024 figures.
National demographic characteristics of SNAP recipients were derived from self-reported data in the 2023 ACS.

Add a Comment