


Editor's Note: This story originally appeared on Construction Coverage.
Increasing global temperatures will bring changes to our environment, economy, and society, but one of the most pronounced effects will be the impact on sea level rise.
A 2019 report from the UN’s Intergovernmental Panel on Climate Change (IPCC) estimated that global mean sea levels will most likely rise between 0.95 feet and 3.61 feet by 2100 due to thermal expansion of water, the melting of glacial ice, and disruption to major ocean currents.
The IPCC estimates that worldwide, high seas could displace or affect 680 million people living in coastal areas.
Around 40% of the U.S. population currently lives in coastal areas that may be vulnerable to sea level rise.
Researchers at Construction Coverage set out to determine which communities are most at risk. Find out about the methodology at the end.
Here are the locations most threatened by sea level rise.
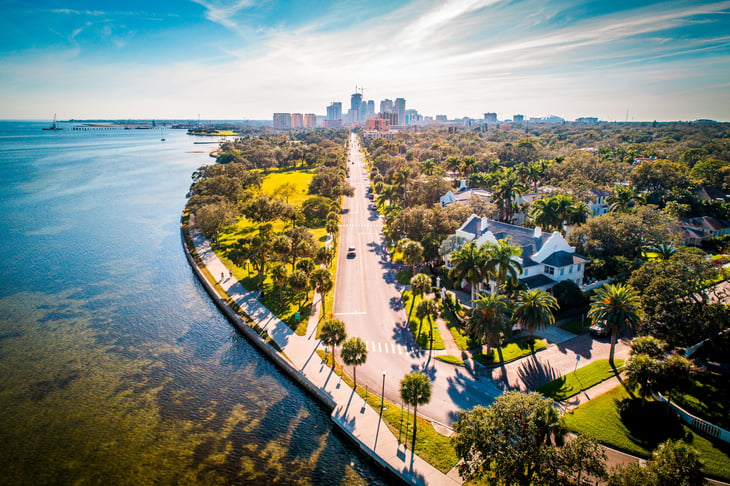
25. Tampa, FL
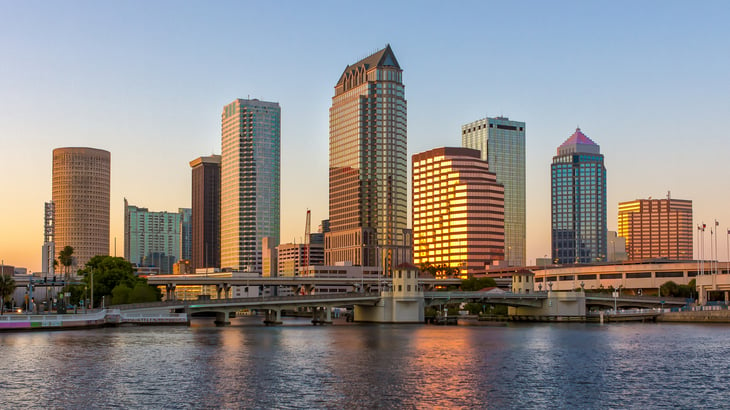
- Share of housing units in risk zones: 16.2% (18,260 units)
- Share of housing value in risk zones: 29.9% ($11,084,477,888)
- Share of new housing units in risk zones: 19.1%
- Share of new housing value in risk zones: 34.2%
- Ratio of home growth in risk zones vs. safe zones: 1.46
24. Huntington Beach, CA
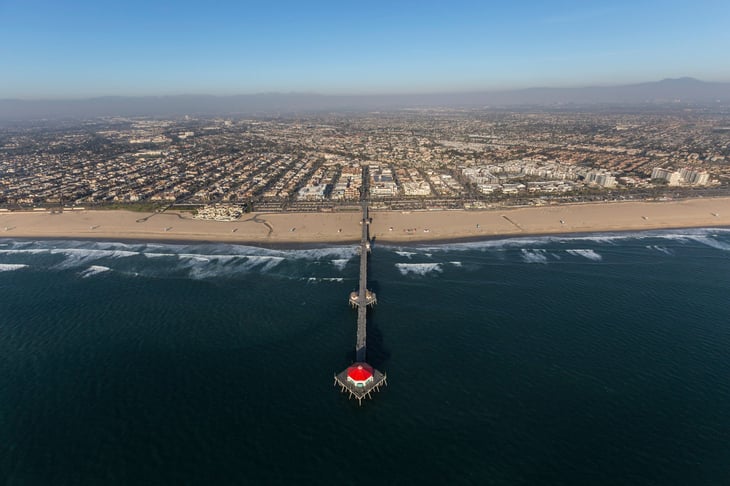
- Share of housing units in risk zones: 21.3% (12,136 units)
- Share of housing value in risk zones: 23.2% ($12,404,124,125)
- Share of new housing units in risk zones: 8.0%
- Share of new housing value in risk zones: 12.2%
- Ratio of home growth in risk zones vs. safe zones: 0.31
23. Stockton, CA

- Share of housing units in risk zones: 23.3% (17,539 units)
- Share of housing value in risk zones: 24.7% ($5,740,624,930)
- Share of new housing units in risk zones: 3.0%
- Share of new housing value in risk zones: 3.4%
- Ratio of home growth in risk zones vs. safe zones: 0.10

22. Boston, MA

- Share of housing units in risk zones: 25.0% (29,534 units)
- Share of housing value in risk zones: 37.4% ($39,167,817,339)
- Share of new housing units in risk zones: 18.3%
- Share of new housing value in risk zones: 74.0%
- Ratio of home growth in risk zones vs. safe zones: 1.72
21. Clearwater, FL
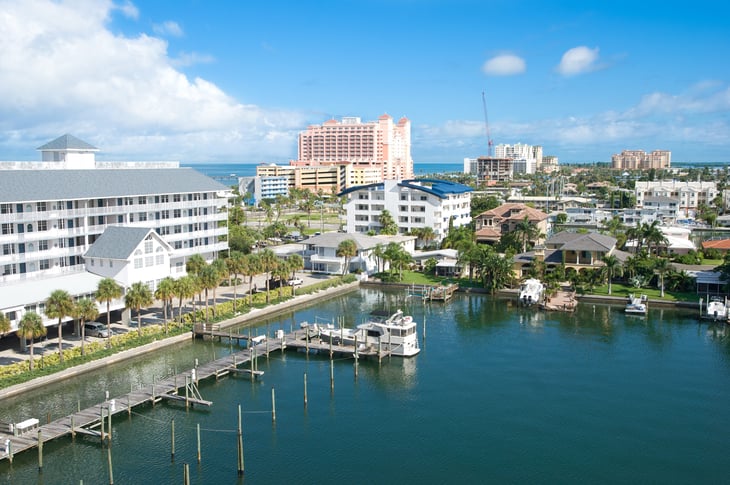
- Share of housing units in risk zones: 25.6% (10,233 units)
- Share of housing value in risk zones: 47.4% ($5,976,288,068)
- Share of new housing units in risk zones: 14.3%
- Share of new housing value in risk zones: 53.0%
- Ratio of home growth in risk zones vs. safe zones: 1.89
20. Chesapeake, VA

- Share of housing units in risk zones: 26.7% (19,936 units)
- Share of housing value in risk zones: 26.9% ($5,664,810,715)
- Share of new housing units in risk zones: 24.2%
- Share of new housing value in risk zones: 24.9%
- Ratio of home growth in risk zones vs. safe zones: 0.88
19. Virginia Beach, VA
- Share of housing units in risk zones: 29.6% (42,293 units)
- Share of housing value in risk zones: 34.8% ($16,482,749,465)
- Share of new housing units in risk zones: 36.9%
- Share of new housing value in risk zones: 44.3%
- Ratio of home growth in risk zones vs. safe zones: 1.51
18. Jersey City, NJ

- Share of housing units in risk zones: 35.3% (16,921 units)
- Share of housing value in risk zones: 52.4% ($16,568,025,211)
- Share of new housing units in risk zones: 16.8%
- Share of new housing value in risk zones: 67.9%
- Ratio of home growth in risk zones vs. safe zones: 0.75
17. St. Petersburg, FL
- Share of housing units in risk zones: 37.0% (33,246 units)
- Share of housing value in risk zones: 49.2% ($12,910,003,794)
- Share of new housing units in risk zones: 0.0%
- Share of new housing value in risk zones: 0.0%
- Ratio of home growth in risk zones vs. safe zones: N/A
16. Honolulu, HI

- Share of housing units in risk zones: 38.0% (40,405 units)
- Share of housing value in risk zones: 16.1% ($27,162,518,458)
- Share of new housing units in risk zones: 5.8%
- Share of new housing value in risk zones: 8.7%
- Ratio of home growth in risk zones vs. safe zones: 1.48
15. Cambridge, MA

- Share of housing units in risk zones: 40.1% (8,340 units)
- Share of housing value in risk zones: 40.8% ($11,010,866,783)
- Share of new housing units in risk zones: 56.9%
- Share of new housing value in risk zones: 84.7%
- Ratio of home growth in risk zones vs. safe zones: 2.22
14. Cape Coral, FL
- Share of housing units in risk zones: 42.5% (32,898 units)
- Share of housing value in risk zones: 52.8% ($11,468,787,539)
- Share of new housing units in risk zones: 72.5%
- Share of new housing value in risk zones: 82.7%
- Ratio of home growth in risk zones vs. safe zones: 1.33
13. San Mateo, CA

- Share of housing units in risk zones: 43.3% (11,359 units)
- Share of housing value in risk zones: 35.9% ($15,267,459,492)
- Share of new housing units in risk zones: 81.1%
- Share of new housing value in risk zones: 73.6%
- Ratio of home growth in risk zones vs. safe zones: 5.02
12. Pompano Beach, FL
- Share of housing units in risk zones: 46.1% (19,787 units)
- Share of housing value in risk zones: 57.3% ($7,090,910,586)
- Share of new housing units in risk zones: 97.7%
- Share of new housing value in risk zones: 92.0%
- Ratio of home growth in risk zones vs. safe zones: 87.3
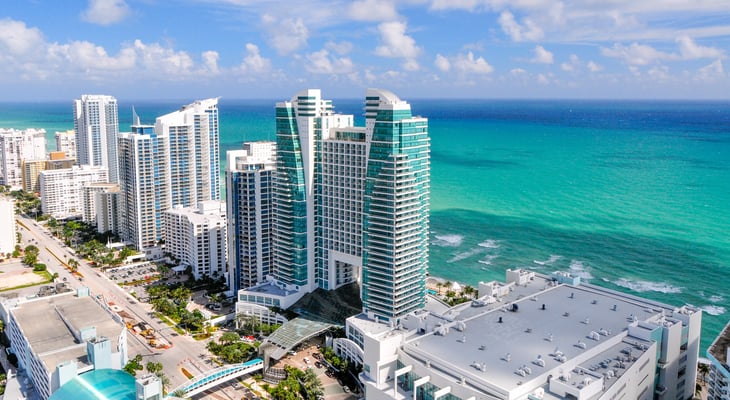
11. Miami, FL

- Share of housing units in risk zones: 46.9% (50,816 units)
- Share of housing value in risk zones: 48.2% ($25,507,729,986)
- Share of new housing units in risk zones: 17.2%
- Share of new housing value in risk zones: 53.2%
- Ratio of home growth in risk zones vs. safe zones: 0.96

10. Charleston, SC

- Share of housing units in risk zones: 50.6% (22,845 units)
- Share of housing value in risk zones: 62.3% ($13,409,123,763)
- Share of new housing units in risk zones: 50.2%
- Share of new housing value in risk zones: 67.9%
- Ratio of home growth in risk zones vs. safe zones: 1.07
9. Hampton, VA

- Share of housing units in risk zones: 50.9% (22,318 units)
- Share of housing value in risk zones: 53.1% ($4,174,490,168)
- Share of new housing units in risk zones: 44.9%
- Share of new housing value in risk zones: 45.2%
- Ratio of home growth in risk zones vs. safe zones: 0.80
8. Norfolk, VA
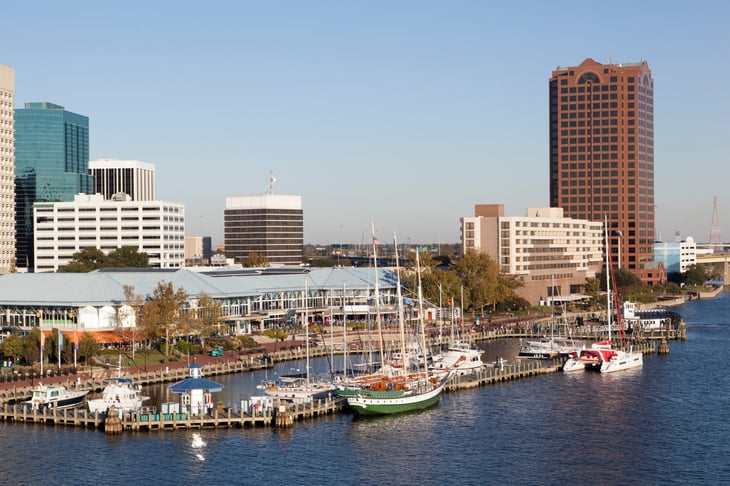
- Share of housing units in risk zones: 51.6% (29,856 units)
- Share of housing value in risk zones: 60.0% ($7,865,157,705)
- Share of new housing units in risk zones: 51.7%
- Share of new housing value in risk zones: 56.0%
- Ratio of home growth in risk zones vs. safe zones: 1.10
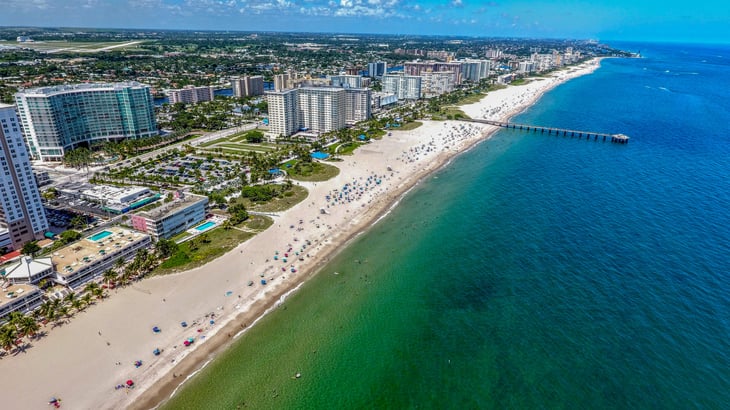
7. Hollywood, FL
- Share of housing units in risk zones: 59.8% (30,533 units)
- Share of housing value in risk zones: 70.0% ($12,090,411,970)
- Share of new housing units in risk zones: 40.8%
- Share of new housing value in risk zones: 71.8%
- Ratio of home growth in risk zones vs. safe zones: 0.58
6. Miami Gardens, FL
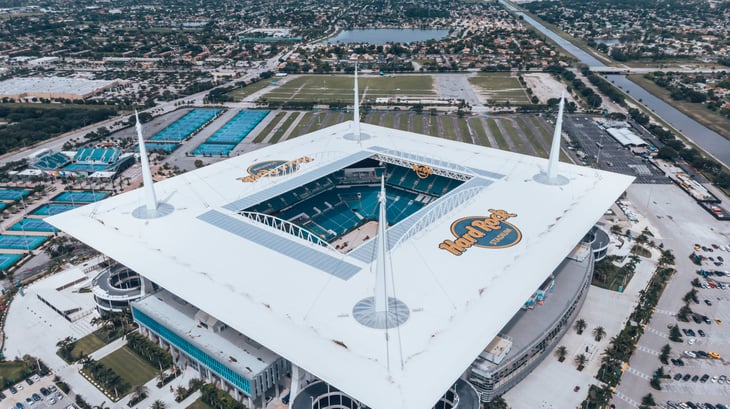
- Share of housing units in risk zones: 71.4% (20,515 units)
- Share of housing value in risk zones: 70.4% ($4,725,426,423)
- Share of new housing units in risk zones: 0.0%
- Share of new housing value in risk zones: 0.0%
- Ratio of home growth in risk zones vs. safe zones: N/A
5. Fort Lauderdale, FL
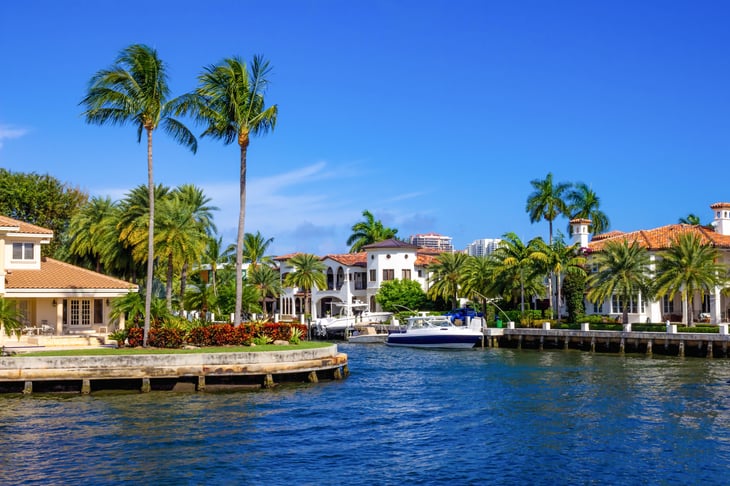
- Share of housing units in risk zones: 73.4% (48,205 units)
- Share of housing value in risk zones: 75.5% ($26,670,397,210)
- Share of new housing units in risk zones: 90.1%
- Share of new housing value in risk zones: 90.0%
- Ratio of home growth in risk zones vs. safe zones: 2.99
4. Hialeah, FL
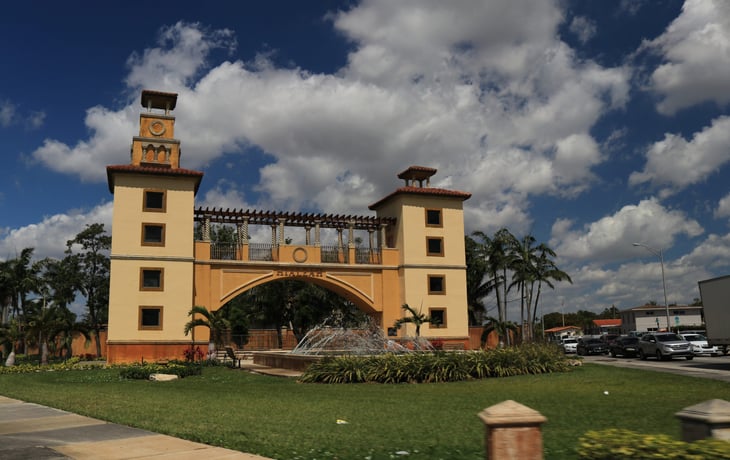
- Share of housing units in risk zones: 90.7% (46,721 units)
- Share of housing value in risk zones: 88.4% ($11,609,490,525)
- Share of new housing units in risk zones: 99.7%
- Share of new housing value in risk zones: 99.6%
- Ratio of home growth in risk zones vs. safe zones: 50.5
3. Davie, FL
- Share of housing units in risk zones: 91.8% (25,832 units)
- Share of housing value in risk zones: 89.3% ($9,973,937,459)
- Share of new housing units in risk zones: 100.0%
- Share of new housing value in risk zones: 100.0%
- Ratio of home growth in risk zones vs. safe zones: ∞
2. Pembroke Pines, FL
- Share of housing units in risk zones: 94.5% (52,551 units)
- Share of housing value in risk zones: 94.8% ($16,103,259,854)
- Share of new housing units in risk zones: 50.0%
- Share of new housing value in risk zones: 72.3%
- Ratio of home growth in risk zones vs. safe zones: 0.06
1. Miramar, FL
- Share of housing units in risk zones: 95.2% (35,074 units)
- Share of housing value in risk zones: 96.3% ($12,093,132,682)
- Share of new housing units in risk zones: 100.0%
- Share of new housing value in risk zones: 100.0%
- Ratio of home growth in risk zones vs. safe zones: ∞
Methodology

The data used in this study is from “Ocean at the Door: New Homes and the Rising Sea,” a research report conducted by Climate Central and Zillow assessing the impact of sea level rise on coastal states and cities in the United States.
Risk zones are defined as areas exposed to a 10 percent or greater annual flood threat based on three different emissions scenarios (deep emissions cuts, moderate emissions cuts, or unchecked pollution) and two different time periods (by 2050 or by 2100).
Only residential buildings, such as single-family homes, condominiums, and duplexes, were included in the analysis. Buildings zoned for commercial or commercial residential use, such as apartment complexes, were not included. New homes were defined as those built after 2009.
To determine the cities most impacted by sea level rise, researchers at Construction Coverage ordered locations based on the share of total housing units projected to be in risk zones by the year 2100, assuming unchecked pollution (i.e. the worst case scenario).
Additionally, researchers included information on the share of housing value in risk zones, the share of new housing (and value) in risk zones, and the ratio of housing growth in risk zones compared to safe zones. Housing growth rates for each zone were calculated by dividing the number of new homes (2010 and later) by the number of existing homes (2009 and earlier).
Only coastal cities with at least 100,000 residents were included in the analysis. Due to insufficient data, the state of Alaska and Alaskan cities were not included.
Add a Comment
Our Policy: We welcome relevant and respectful comments in order to foster healthy and informative discussions. All other comments may be removed. Comments with links are automatically held for moderation.