
This story originally appeared on Porch.
While development of single-family homes has trended down for decades, the COVID-19 outbreak has renewed their appeal.
The Census Bureau recently reported that new single-family housing units authorized by building permits grew 17% between June and July 2020.
Likewise, sales of new single-family homes in July 2020 were 13.9% higher than in June 2020, and 36.3% higher than in July 2019.
As homebuyers leave densely populated areas, the growing interest in single-family homes may usher in a new wave of low-density housing development.
While many American cities are known for high-density living, others offer more space and can accommodate a larger proportion of single-family homes.
The data used in this analysis is from the U.S. Census Bureau’s Building Permits Survey. The survey includes new housing projects authorized by building permits.
To identify the locations investing the most in single-family homes, Porch calculated the share of all 2019 building permits that were for one-unit projects — what the Census Bureau considers to be single-family homes. This includes fully detached units, semidetached units, row houses and townhouses.
Locations were ordered by the share of new housing units that were single-family homes in 2019. In the event of a tie, the location with the greater number of single-family homes authorized by building permits was ranked higher. We also included statistics on existing single-family homes (detached and attached), which come from the 2018 American Community Survey one-year estimates.
Following are the large metros investing the most in single-family homes, followed by those investing the least.
Metros investing the most:
15. St. Louis

- Share of new housing units that are single-family homes (2019): 73.4%
- Share of existing housing units that are single-family homes: 73.6%
- Total new single-family homes (2019): 5,179
- Total new housing units (2019): 7,054
14. Virginia Beach, Virginia
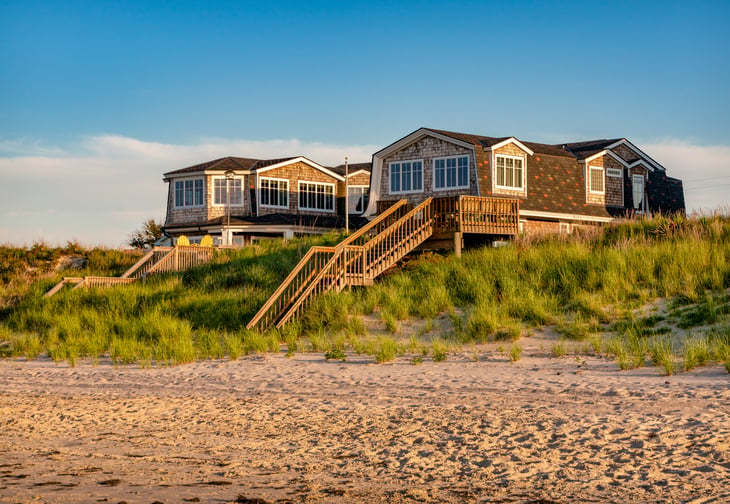
- Share of new housing units that are single-family homes (2019): 73.5%
- Share of existing housing units that are single-family homes: 70.5%
- Total new single-family homes (2019): 4,345
- Total new housing units (2019): 5,908
13. Cincinnati
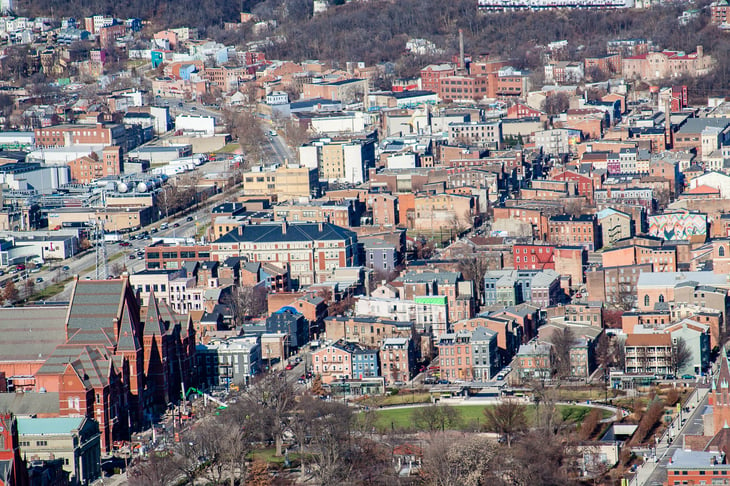
- Share of new housing units that are single-family homes (2019): 74.5%
- Share of existing housing units that are single-family homes: 69.9%
- Total new single-family homes (2019): 4,488
- Total new housing units (2019): 6,023
12. Sacramento, California

- Share of new housing units that are single-family homes (2019): 76.2%
- Share of existing housing units that are single-family homes: 73.5%
- Total new single-family homes (2019): 7,184
- Total new housing units (2019): 9,431
11. Riverside, California

- Share of new housing units that are single-family homes (2019): 76.4%
- Share of existing housing units that are single-family homes: 73.7%
- Total new single-family homes (2019): 11,147
- Total new housing units (2019): 14,599
10. Providence, Rhode Island

- Share of new housing units that are single-family homes (2019): 77.7%
- Share of existing housing units that are single-family homes: 57.6%
- Total new single-family homes (2019): 1,592
- Total new housing units (2019): 2,048
9. Jacksonville, Florida

- Share of new housing units that are single-family homes (2019): 78.9%
- Share of existing housing units that are single-family homes: 67.3%
- Total new single-family homes (2019): 11,583
- Total new housing units (2019): 14,687
8. Atlanta

- Share of new housing units that are single-family homes (2019): 80%
- Share of existing housing units that are single-family homes: 72.1%
- Total new single-family homes (2019): 26,261
- Total new housing units (2019): 32,836
7. New Orleans

- Share of new housing units that are single-family homes (2019): 80.5%
- Share of existing housing units that are single-family homes: 67.1%
- Total new single-family homes (2019): 3,241
- Total new housing units (2019): 4,026
6. Tucson, Arizona

- Share of new housing units that are single-family homes (2019): 80.9%
- Share of existing housing units that are single-family homes: 67.4%
- Total new single-family homes (2019): 3,490
- Total new housing units (2019): 4,313
5. Raleigh, North Carolina

- Share of new housing units that are single-family homes (2019): 83.6%
- Share of existing housing units that are single-family homes: 71%
- Total new single-family homes (2019): 11,142
- Total new housing units (2019): 13,320
4. Cleveland

- Share of new housing units that are single-family homes (2019): 85.2%
- Share of existing housing units that are single-family homes: 70.7%
- Total new single-family homes (2019): 2,584
- Total new housing units (2019): 3,032
3. Memphis, Tennessee

- Share of new housing units that are single-family homes (2019): 90.3%
- Share of existing housing units that are single-family homes: 72.5%
- Total new single-family homes (2019): 3,319
- Total new housing units (2019): 3,674
2. Oklahoma City

- Share of new housing units that are single-family homes (2019): 90.3%
- Share of existing housing units that are single-family homes: 74.2%
- Total new single-family homes (2019): 5,924
- Total new housing units (2019): 6,557
1. Birmingham, Alabama

- Share of new housing units that are single-family homes (2019): 95.7%
- Share of existing housing units that are single-family homes: 71.6%
- Total new single-family homes (2019): 3,063
- Total new housing units (2019): 3,202
Metros investing the least:
15. Kansas City, Missouri

- Share of new housing units that are single-family homes (2019): 51.5%
- Share of existing housing units that are single-family homes: 75.6%
- Total new single-family homes (2019): 4,811
- Total new housing units (2019): 9,347
14. Washington, D.C.
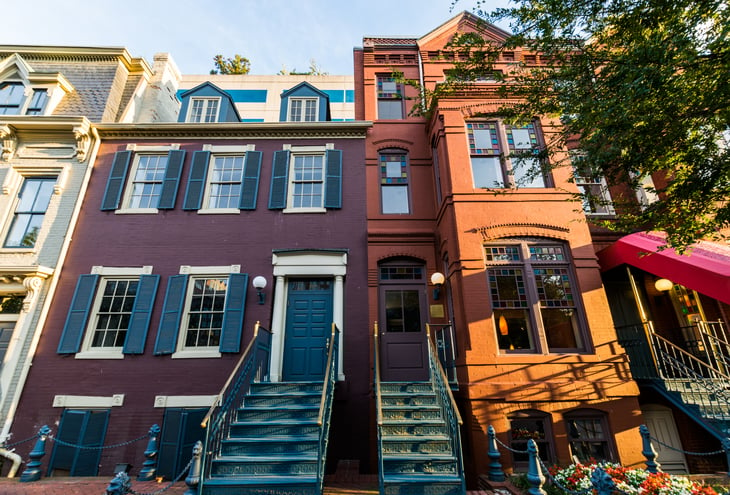
- Share of new housing units that are single-family homes (2019): 48.4%
- Share of existing housing units that are single-family homes: 65.3%
- Total new single-family homes (2019): 12,977
- Total new housing units (2019): 26,804
13. Portland, Oregon

- Share of new housing units that are single-family homes (2019): 45.7%
- Share of existing housing units that are single-family homes: 66.3%
- Total new single-family homes (2019): 7,688
- Total new housing units (2019): 16,815
12. Philadelphia

- Share of new housing units that are single-family homes (2019): 44.6%
- Share of existing housing units that are single-family homes: 73.7%
- Total new single-family homes (2019): 6,963
- Total new housing units (2019): 15,607
11. Salt Lake City

- Share of new housing units that are single-family homes (2019): 44.6%
- Share of existing housing units that are single-family homes: 69.6%
- Total new single-family homes (2019): 4,760
- Total new housing units (2019): 10,680
10. Minneapolis

- Share of new housing units that are single-family homes (2019): 42.9%
- Share of existing housing units that are single-family homes: 70.8%
- Total new single-family homes (2019): 9,610
- Total new housing units (2019): 22,414
9. Chicago

- Share of new housing units that are single-family homes (2019): 42%
- Share of existing housing units that are single-family homes: 59.5%
- Total new single-family homes (2019): 7,598
- Total new housing units (2019): 18,085
8. San Jose, California

- Share of new housing units that are single-family homes (2019): 41.8%
- Share of existing housing units that are single-family homes: 62.9%
- Total new single-family homes (2019): 2,603
- Total new housing units (2019): 6,230
7. San Diego

- Share of new housing units that are single-family homes (2019): 36.7%
- Share of existing housing units that are single-family homes: 60%
- Total new single-family homes (2019): 3,019
- Total new housing units (2019): 8,216
6. Miami
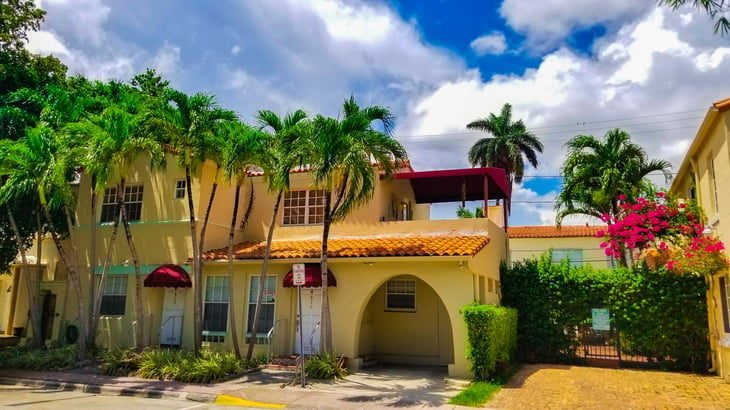
- Share of new housing units that are single-family homes (2019): 35%
- Share of existing housing units that are single-family homes: 51%
- Total new single-family homes (2019): 7,241
- Total new housing units (2019): 20,688
5. Seattle

- Share of new housing units that are single-family homes (2019): 32.8%
- Share of existing housing units that are single-family homes: 62.7%
- Total new single-family homes (2019): 8,737
- Total new housing units (2019): 26,599
4. Los Angeles
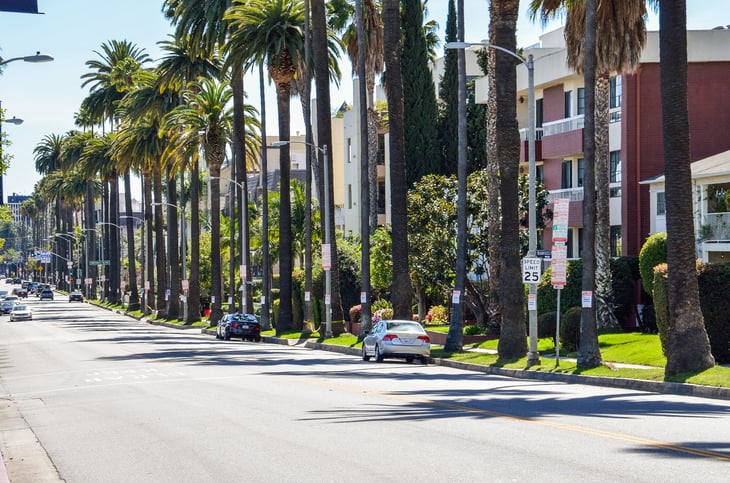
- Share of new housing units that are single-family homes (2019): 30.5%
- Share of existing housing units that are single-family homes: 56.4%
- Total new single-family homes (2019): 9,306
- Total new housing units (2019): 30,554
3. San Francisco

- Share of new housing units that are single-family homes (2019): 29.4%
- Share of existing housing units that are single-family homes: 58.8%
- Total new single-family homes (2019): 4,076
- Total new housing units (2019): 13,881
2. Boston

- Share of new housing units that are single-family homes (2019): 28.5%
- Share of existing housing units that are single-family homes: 53%
- Total new single-family homes (2019): 4,299
- Total new housing units (2019): 15,088
1. New York

- Share of new housing units that are single-family homes (2019): 18.1%
- Share of existing housing units that are single-family homes: 43.2%
- Total new single-family homes (2019): 11,072
- Total new housing units (2019): 61,168


Add a Comment
Our Policy: We welcome relevant and respectful comments in order to foster healthy and informative discussions. All other comments may be removed. Comments with links are automatically held for moderation.