


Editor's Note: This story originally appeared on Commodity.com.
Throughout the COVID-19 pandemic, the Federal Reserve Bank and Congress have taken unprecedented steps to stabilize the economy after entire industries and sectors ground to a halt last year amidst the public health crisis.
The Fed has kept interest rates near zero, created lending programs to pump trillions of dollars into the economy, and bought securities to support financial markets. And Congress passed three major COVID-19 stimulus packages in response to the crisis: the $2.2 trillion CARES Act in March 2020, the $900 billion Coronavirus Response and Relief Supplemental Appropriations Act in December 2020, and the $1.9 trillion American Rescue Plan in March 2021.
These actions helped American households and businesses weather the pandemic in better financial shape than many would have predicted when COVID-19 lockdowns began last March.
While millions remain out of work and many businesses have shuttered or remain on the brink, some sectors of the economy easily adapted to COVID-19. Many households — especially higher earners — saw their wealth grow from increased savings, robust government stimulus, and strong stock market returns. And as life in the U.S. returns to normal amid declining COVID-19 case numbers, pent-up demand has lifted hard-hit sectors like transportation, retail, tourism, and hospitality this summer.
However, certain investors, economists, and other experts have begun to express fears that the unusual conditions of the COVID-19 economy and large amounts of government stimulus are bringing on a new economic challenge: inflation. These observers worry that the amount of money in the economy and quickly recovering demand in many sectors will continue pushing prices higher throughout this year.
One of the primary measures used to track inflation is the Consumer Price Index, which is based on prices for food, clothing, shelter, fuels, transportation fares, service fees, and sales taxes. The index measures price changes as a percentage from a predetermined reference date to recognize periods of inflation and deflation.
Based on data from 2021, the CPI is showing a steep upward trend in prices, an indication that inflation is on the rise. June 2021 saw a 5.4% increase in prices year-over-year, the largest single-month increase since before the markets crashed in 2008.
Energy and transportation have seen massive price increases since last year

These trends have provoked different responses from economic observers. Some individual and institutional investors are looking to hedge against rising inflation rates by rushing to invest in gold, cryptocurrency, and other investments, which they believe will hold their value better than the dollar and outperform the market during periods of inflation.
Others argue that current price trends are transitory and merely reflective of the ongoing effects of supply chain breakdowns during the pandemic and shifts in consumer demand as more activities like travel become safer again.
Those in the latter camp can point to the difference in increases across CPI categories as evidence that inflation may be more of a temporary correction than a long-term threat. Food and beverages (up 2.4% year-over-year) and housing (up 3.1%) are close to the Fed’s usual target inflation figure of 2%.
However, transportation has seen a 21.5% increase, largely from increases in the price of new and used cars, which are more scarce because of supply chain breakdowns and part shortages. Additionally, compared with last year’s record low prices, the cost of airline tickets is up with more people traveling. Similarly, energy showed a 24.5% increase year-over-year, following sharp declines in oil and gas prices during lockdowns.
Large metros with the highest rates of inflation

Inflation is also experienced differently in different markets, with some communities seeing more price increases and others having prices remain relatively stable.
To identify the locations with the highest rates of inflation, researchers at Commodity.com calculated the year-over-year percentage change in CPI for “all items” as defined by the U.S. Bureau of Labor Statistics. Researchers also calculated the year-over-year changes for the following CPI indexes: food and beverage, housing, apparel, transportation, and energy. Only the nation’s 23 largest metropolitan areas tracked by the BLS were included in the analysis.
The following are the 15 major metros with the highest rates of inflation.
15. Houston-The Woodlands-Sugar Land, TX
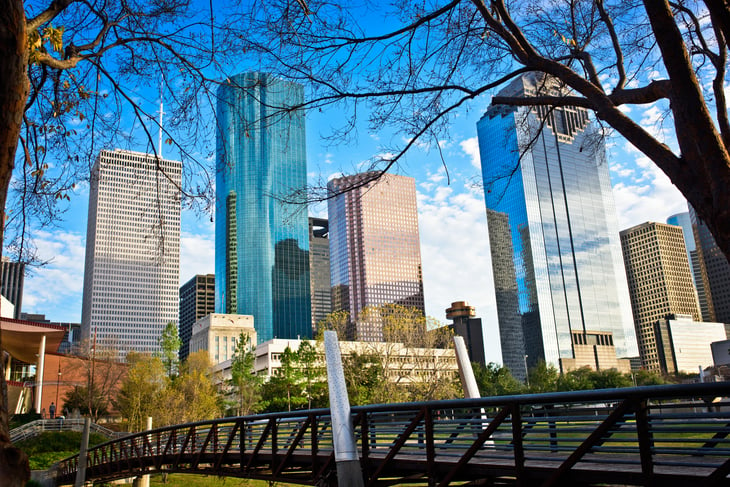
- All items: +4.6%
- Food and beverage: +2.3%
- Housing: +2.8%
- Apparel: -5.5%
- Transportation: +18.4%
- Energy: +29.7%

14. Minneapolis-St. Paul-Bloomington, MN-WI
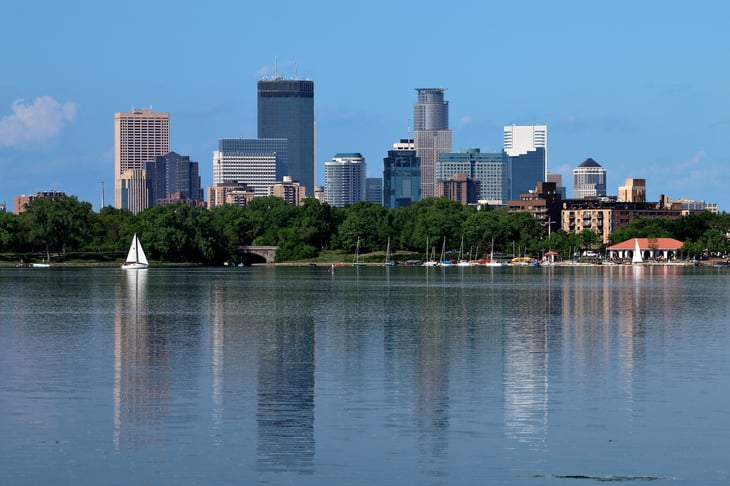
- All items: +4.6%
- Food and beverage: +1.9%
- Housing: +1.4%
- Apparel: +9.9%
- Transportation: +21.0%
- Energy: +24.4%
13. Chicago-Naperville-Elgin, IL-IN-WI
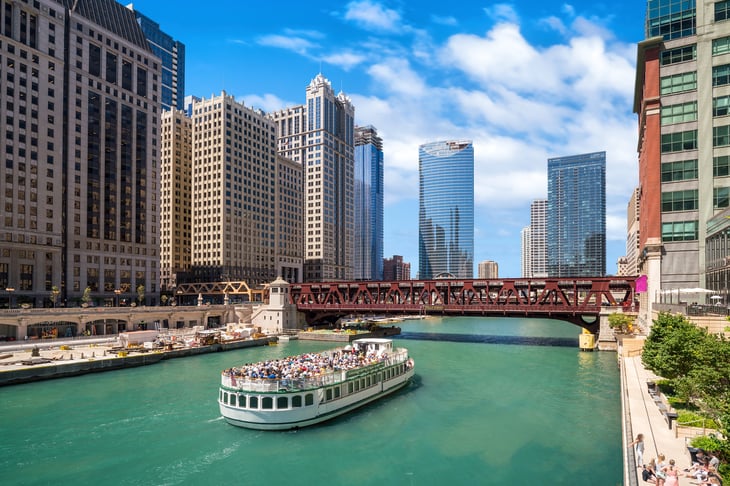
- All items: +4.7%
- Food and beverage: +4.8%
- Housing: +3.7%
- Apparel: +4.0%
- Transportation: +17.0%
- Energy: +28.7%
12. Philadelphia-Camden-Wilmington, PA-NJ-DE-MD

- All items: +4.9%
- Food and beverage: +0.9%
- Housing: +2.7%
- Apparel: +6.9%
- Transportation: +18.9%
- Energy: +19.8%
11. Miami-Fort Lauderdale-West Palm Beach, FL
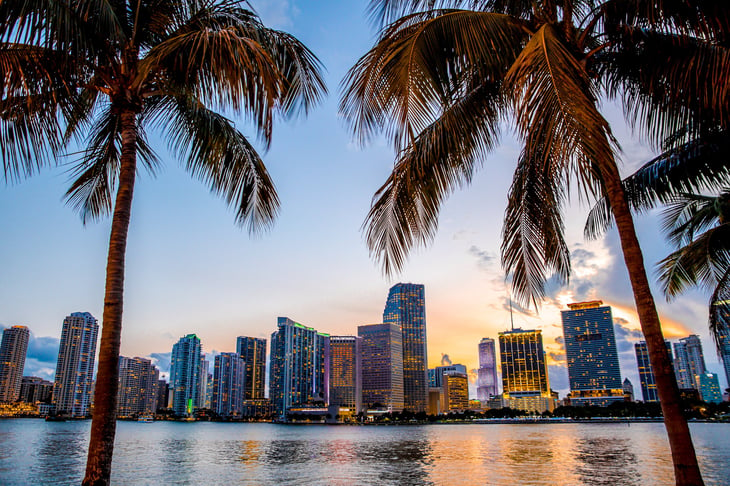
- All items: +5.1%
- Food and beverage: +0.8%
- Housing: +3.6%
- Apparel: +8.4%
- Transportation: +20.1%
- Energy: +26.7%
10. San Diego-Carlsbad, CA
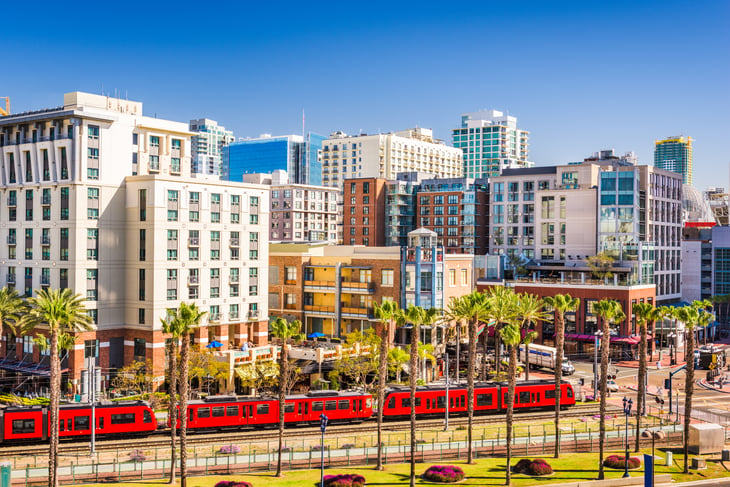
- All items: +5.3%
- Food and beverage: +2.2%
- Housing: +2.6%
- Apparel: +7.5%
- Transportation: +22.0%
- Energy: +31.3%
9. Phoenix-Mesa-Scottsdale, AZ

- All items: +5.4%
- Food and beverage: +2.4%
- Housing: +4.2%
- Apparel: +11.1%
- Transportation: +16.9%
- Energy: +20.7%
8. Detroit-Warren-Dearborn, MI

- All items: +5.4%
- Food and beverage: +5.3%
- Housing: +5.0%
- Apparel: -3.2%
- Transportation: +12.0%
- Energy: +24.9%
7. Seattle-Tacoma-Bellevue, WA
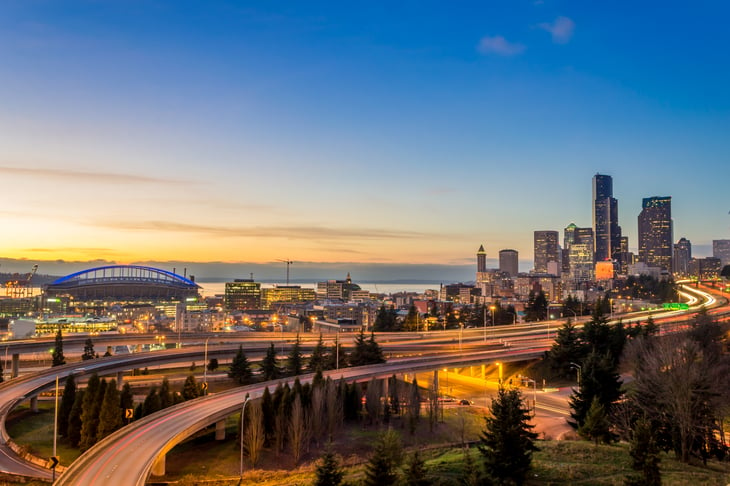
- All items: +5.5%
- Food and beverage: +5.6%
- Housing: +1.9%
- Apparel: +8.3%
- Transportation: +21.7%
- Energy: +25.1%
6. Riverside-San Bernardino-Ontario, CA

- All items: +5.9%
- Food and beverage: +2.5%
- Housing: +3.3%
- Apparel: +5.2%
- Transportation: +22.8%
- Energy: +28.0%
5. St. Louis, MO-IL

- All items: +6.1%
- Food and beverage: +3.5%
- Housing: +4.4%
- Apparel: +7.0%
- Transportation: +20.7%
- Energy: +24.1%

4. Tampa-St. Petersburg-Clearwater, FL
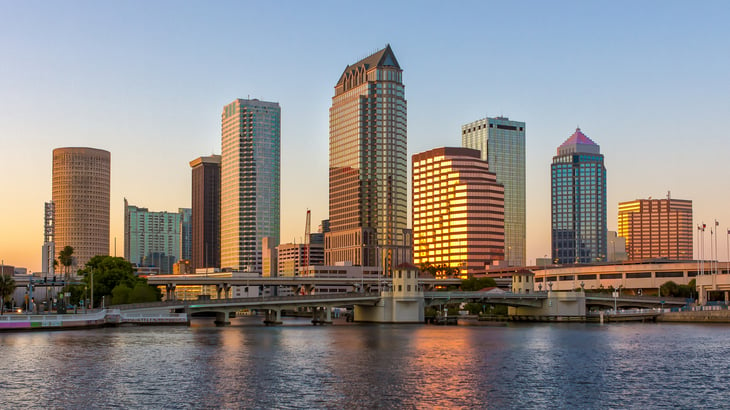
- All items: +6.2%
- Food and beverage: +1.9%
- Housing: +5.5%
- Apparel: +5.5%
- Transportation: +17.9%
- Energy: +25.3%
3. Urban Alaska
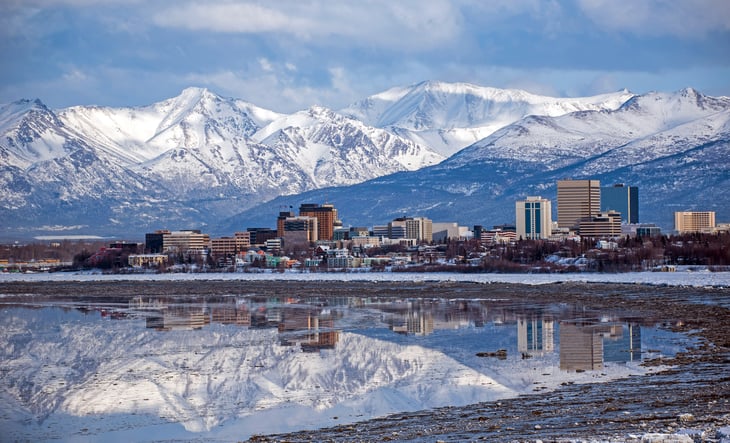
- All items: +6.2%
- Food and beverage: +2.5%
- Housing: +2.8%
- Apparel: +5.7%
- Transportation: +26.8%
- Energy: +18.3%
2. Dallas-Fort Worth-Arlington, TX

- All items: +6.3%
- Food and beverage: +2.8%
- Housing: +2.8%
- Apparel: +7.8%
- Transportation: +28.2%
- Energy: +25.3%
1. Atlanta-Sandy Springs-Roswell, GA

- All items: +6.7%
- Food and beverage: +1.7%
- Housing: +4.1%
- Apparel: +11.2%
- Transportation: +23.9%
- Energy: +27.5%
Detailed Findings & Methodology
The data used in this analysis is from the Bureau of Labor Statistics (BLS) Consumer Price Index (CPI) Databases from June of 2021.
To determine the locations with the highest rates of inflation, researchers calculated the latest year-over-year percentage change in CPI for “all items” as defined by the BLS.
Researchers also calculated the year-over-year changes for the following CPI indexes: food and beverage, housing, apparel, transportation, and energy.
Add a Comment
Our Policy: We welcome relevant and respectful comments in order to foster healthy and informative discussions. All other comments may be removed. Comments with links are automatically held for moderation.