
Not since just before the Great Depression has the income gap between rich and poor Americans been so vast. The top 1 percent of U.S. families has an income, on average, $1,153,293 a year — about 25 times the $45,567 earned on average by the rest of American families.
Those numbers are from a report, “Income Inequality in the U.S. by State, Metropolitan Area, and County,” by the Economic Policy Institute. EPI, a nonpartisan think tank, examined state-level tax data from 1917 through 2013 (the latest year available) to report the gap, the earnings and the trends in every state.
Overall, the top 1 percent of earners took home 20.1 percent of all income in the U.S. in 2013. Mark Price, a labor economist at the Keystone Research Center and study co-author, says, in an email interview:
Although we observe different levels of inequality across the states, over time we observe that inequality has gotten much greater across all states since 1979. So while inequality may be worse in New York than in parts of the South, inequality is up in the South as well, and that is largely because an increasing amount of income is flowing to the top 1 percent of families in every part of the country.
Do you belong in the 1 percent?

Think you might squeak onto the bottom rung of the top 1 percent? If you have to wonder, you probably don’t belong, as they say. You’d have to earn $389,436 per year to make the cut nationally. But if you don’t qualify, you might be among the top 1 percent in a smaller pond: your state.
Read on to find out. We’ve ranked the 50 states and Washington, D.C., from bottom to top by average annual income of the top 1 percent of earners. You’ll also find:
- Entry level earnings for the top 1 percent.
- Average earnings of bottom 99 percent (everyone else).
- Top 1 percent’s share of total income in the state.
51. West Virginia: $488,634 per year

State by state, the average earnings of the 1 percent vary greatly. In West Virginia, for example, 1-percenters earned less than $489,000 a year, on average — a lot of money, to be sure, but that’s a fifth of the $2.4 million earned in 2013, on average, by the top 1 percent in the top-earning state.
The study found relatively less inequality in rural places and bigger income gaps in cities and suburban counties. Study co-author Mark Price says that’s probably because there’s a smaller concentration of high-income occupations — like corporate CEOs, top managers and financial services jobs — in predominantly rural states like West Virginia than in, say, New York state.
Still, inequality is up in rural areas and cities. That’s because, Price says, “an increasing amount of income is flowing to the top 1 percent of families in every part of the country.”
For West Virginia, the study found:
- Entry-level earnings for top 1 percent: $244,879/year
- Average earnings of bottom 99 percent: $34,407/year
- Top 1 percent’s share of income in the state: 12.4 percent
50. Mississippi: $565,813 per year

Mississippi, like other predominantly rural states, has a relatively smaller gap between rich and poor — even though the average Mississippi 1-percenter earns more than a half-million dollars a year.
- Entry-level earnings for top 1 percent: $264,952/year
- Average earnings of bottom 99 percent: $33,383/year
- Top 1 percent’s share of income in the state: 14.4 percent
49. New Mexico: $593,739 per year

- Entry-level earnings for top 1 percent: $231,276/year.
- Average earnings of bottom 99 percent: $37,995/year.
- Top 1 percent’s share of income in the state: 13.4 percent.
48. Maine: $612,494 per year

- Entry-level earnings for top 1 percent: $282,474/year.
- Average earnings of bottom 99 percent: $41,165/year.
- Top 1 percent’s share of income in the state: 12.9 percent.
47. Kentucky: $619,585 per year

- Entry-level earnings for top 1 percent: $267,635/year
- Average earnings of bottom 99 percent: $37,371/year
- Top 1 percent’s share of income in the state: 14.1 percent
46. Alabama: $665,097 per year

The rural-urban differences in wealth distribution are clear in Alabama’s relatively smaller inequality gap. Those among the wealthiest 1 percent in Alabama make $665,097 a year compared with the $38,854 earned, on average, by everyone else in the state. Although the wealthy in the South take home a great deal of money each year, the highest incomes here are dwarfed by the average earnings of the 1 percent in states with bigger urban centers.
- Entry-level earnings for top 1 percent: $283,899/year
- Average earnings of bottom 99 percent: $38,854/year
- Top 1 percent’s share of income in the state: 14.5 percent
45. South Carolina: $668,739 per year

- Entry-level earnings for top 1 percent: $288,042/year
- Average earnings of bottom 99 percent: $36,950/year
- Top 1 percent’s share of income in the state: 15.2 percent
44. Hawaii: $690,073 per year

- Entry-level earnings for top 1 percent: $281,620/year
- Average earnings of bottom 99 percent: $51,033/year
- Top 1 percent’s share of income in the state: 11.9 percent
43. Iowa: $714,758 per year

- Entry-level earnings for top 1 percent: $317,234/year
- Average earnings of bottom 99 percent: $51,248/year
- Top 1 percent’s share of income in the state: 12.2 percent
42. Indiana: $717,688 per year

- Entry-level earnings for top 1 percent: $296,640/year
- Average earnings of bottom 99 percent: $43,426/year
- Top 1 percent’s share of income in the state: 14.1 percent
41. Montana: $730,864 per year

The average Montanan in the bottom 99 percent makes $42,000 a year. But the average earnings among the state’s 1 percent are raised appreciably by the presence in Montana of Glacier National Park. Kalispell, the gateway to Glacier Park, ranks 43rd among Bloomberg’s richest small towns in America.
- Entry-level earnings for top 1 percent: $297,689/year
- Average earnings of bottom 99 percent: $42,013/year
- Top 1 percent’s share of income in the state: 14.7 percent
40. Vermont: $735,607 per year

- Entry-level earnings for top 1 percent: $299,259/year
- Average earnings of bottom 99 percent: $45,719/year
- Top 1 percent’s share of income in the state: 13.8 percent
39. Idaho: $738,278 per year

Idaho has large rural swathes, and Boise, although it is booming and home to ever more tech and other companies, is — sorry, Boise — no New York City with NYC salaries. But Idaho’s higher earners aren’t all in the biggest city. They’re also in Hailey, central to the wealth and glitter of the Sun Valley-Ketchum resort area.
- Entry-level earnings for top 1 percent: $292,324/year
- Average earnings of bottom 99 percent: $45,254/year
- Top 1 percent’s share of income in the state: 14.0 percent
38. North Carolina: $745,686 per year

- Entry-level earnings for top 1 percent: $327,549/year
- Average earnings of bottom 99 percent: $42,162/year
- Top 1 percent’s share of income in the state: 14.9 percent
37: Arkansas: $750,101 per year

- Entry-level earnings for top 1 percent: $237,428/year
- Average earnings of bottom 99 percent: $36,421/year
- Top 1 percent’s share of income in the state: 17 percent
36. Ohio: $752,582 per year
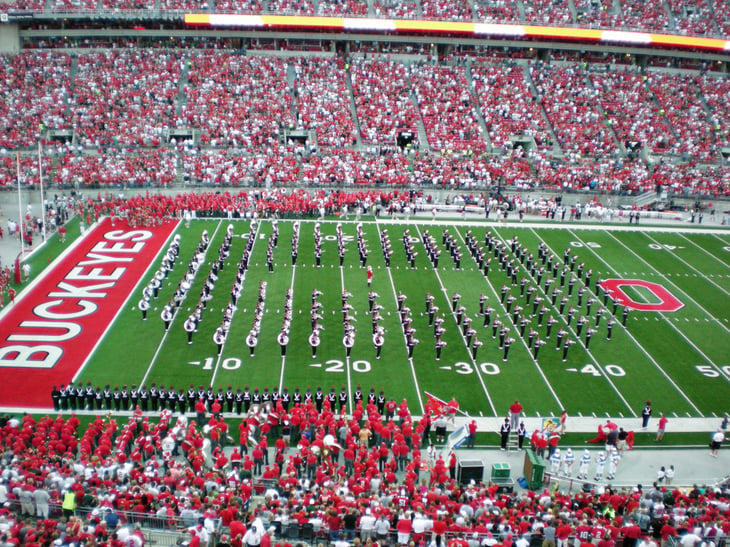
- Entry-level for top 1 percent: $317,124/year
- Average earnings of bottom 99 percent: $42,391/year
- Top 1 percent’s share of income in the state: 15 percent
35. Oregon: $754,431 per year

- Entry-level for top 1 percent: $312,839/year
- Average earnings of bottom 99 percent: $40,719/year
- Top 1 percent’s share of income in the state: 15.5 percent
34. Delaware: $768,109 per year

- Entry-level for top 1 percent: $342,699/year
- Average earnings of bottom 99 percent: $48,371/year
- Top 1 percent’s share of income in the state: 13.6 percent
33. Arizona: $784,469 per year

- Entry-level for top 1 percent: $309,102/year
- Average earnings of bottom 99 percent: $38,354/year
- Top 1 percent’s share of income in the state: 16.9 percent
32. Tennessee: $820,373 per year

- Entry-level for top 1 percent: $308,834/year
- Average earnings of bottom 99 percent: $40,156/year
- Top 1 percent’s share of income in the state: 16.9 percent
31. Alaska: $833,117 per year
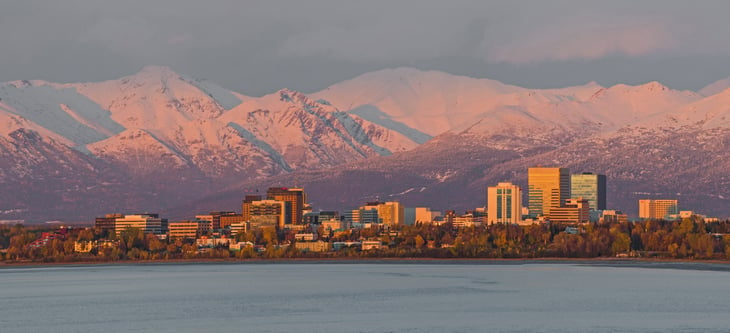
The wealth gap in Alaska is lower than in most states because, although the earnings of the average 1-percenter approach $1 million a year, the bottom 99 percent make more than in many other states.
- Entry-level for top 1 percent: $365,332/year
- Average earnings of bottom 99 percent: $63,226/year
- Top 1 percent’s share of income in the state: 11.6 percent
30. Missouri: $833,823 per year

- Entry-level for top 1 percent: $305,471/year
- Average earnings of bottom 99 percent: $41,641/year
- Top 1 percent’s share of income in the state: 16.6 percent
29. Michigan: $834,008 per year

- Entry-level for top 1 percent: $306,740/year
- Average earnings of bottom 99 percent: $37,896/year
- Top 1 percent’s share of income in the state: 17.9 percent
28. Georgia: $857,728 per year

- Entry-level for top 1 percent: $345,876/year
- Average earnings of bottom 99 percent: $40,095/year
- Top 1 percent’s share of income in the state: 17.5 percent
27. Louisiana: $859,619 per year

- Entry-level for top 1 percent: $325,163/year
- Average earnings of bottom 99 percent: $41,600/year
- Top 1 percent’s share of income in the state: 17 percent
26. Nebraska: $872,892 per year

- Entry-level for top 1 percent: $346,252/year
- Average earnings of bottom 99 percent: $57,076/year
- Top 1 percent’s share of income in the state: 13.2 percent
25. Rhode Island: $884,609 per year

- Entry-level for top 1 percent: $336,625/year
- Average earnings of bottom 99 percent: $47,545/year
- Top 1 percent’s share of income in the state: 15.6 percent
24. Wisconsin: $888,121 per year

- Entry-level for top 1 percent: $312,375/year
- Average earnings of bottom 99 percent: $46,669/year
- Top 1 percent’s share of income in the state: 15.9 percent
23. Pennsylvania: $926,051 per year
The earnings gap between the richest and everyone else starts widening in states like Pennsylvania, where the average income for the 99 percent isn’t that much different from elsewhere but the average earnings of the top 1 percent reach nearly $1 million per year.
- Entry-level for top 1 percent: $360,343/year
- Average earnings of bottom 99 percent: $45,781/year
- Top 1 percent’s share of income in the state: 16.7 percent
22. Oklahoma: $930,201 per year

- Entry-level for top 1 percent: $324,935/year
- Average earnings of bottom 99 percent: $44,849/year
- Top 1 percent’s share of income in the state: 17.1 percent
21. Utah: $940,662 per year

Utah has Salt Lake City, which brings up average incomes. But, at least equally important to the wealth gap, it also has resort communities like Summit Park, home of the Park City Mountain Resort, which Bloomberg News ranks first among the 20 richest small towns in America, and Heber, a wealthy nearby tourist area.
Utah is a growing magnet for corporate jobs, too. Bloomberg says, “Utah has companies like Adobe and Goldman Sachs settling in and creating job opportunities in cities within commuting distance of its mountain towns.”
- Entry-level for top 1 percent: $333,775/year
- Average earnings of bottom 99 percent: $50,367/year
- Top 1 percent’s share of income in the state: 15.7 percent
20. Kansas: $981,279 per year

- Entry-level for top 1 percent: $351,497/year
- Average earnings of bottom 99 percent: $50,367/year
- Top 1 percent’s share of income in the state: 16.2 percent
19. Virginia: $987,607 per year

- Entry-level for top 1 percent: $406,412/year
- Average earnings of bottom 99 percent: $55,743/year
- Top 1 percent’s share of income in the state: 15 percent
18. New Hampshire: $1,011,141 per year

- Entry-level for top 1 percent: $359,844/year
- Average earnings of bottom 99 percent: $56,475/year
- Top 1 percent’s share of income in the state: 15.1 percent
17. Maryland: $1,024,110 per year

- Entry-level for top 1 percent: $421,188/year
- Average earnings of bottom 99 percent: $60,172/year
- Top 1 percent’s share of income in the state: 14.5 percent
16. South Dakota: $1,025,091 per year

- Entry-level for top 1 percent: $386,622/year
- Average earnings of bottom 99 percent: $53,213/year
- Top 1 percent’s share of income in the state: 16.1 percent
15. Minnesota: $1,035,928 per year

- Entry-level for top 1 percent: $411,022/year
- Average earnings of bottom 99 percent: $52,689/year
- Top 1 percent’s share of income in the state: 16.3 percent
14. Washington: $1,100,186 per year

Now we’re talking some real money. In booming high-tech Seattle, the average 1-percenter makes more than a million dollars a year. Inequality is higher, too, with the 1 percent taking home almost one-fifth of earnings in the state. The small town of Oak Harbor, Washington, ranks 18th in Bloomberg’s list of wealthiest small towns in America.
- Entry-level for top 1 percent: $387,854/year
- Average earnings of bottom 99 percent: $50,372/year
- Top 1 percent’s share of income in the state: 17.8 percent
13. Colorado: $1,101,214 per year

Helping raise the average income for Colorado’s 1-percenters are the resort towns of Vail and Beaver Creek, located near Edwards, which Bloomberg ranks the second-richest small town in America, in addition to four other “richest” small towns: Breckenridge (No. 5), Glenwood Springs (No. 7), Steamboat Springs (No. 9) and Durango (No. 16).
- Entry-level for top 1 percent: $410,716/year
- Average earnings of bottom 99 percent: $54,809/year
- Top 1 percent’s share of income in the state: 16.6 percent
12. Illinois: $1,207,547 per year

- Entry-level for top 1 percent: $416,319/year
- Average earnings of bottom 99 percent: $48,684/year
- Top 1 percent’s share of income in the state: 19.8 percent
11. Florida: $1,265,774 per year

- Entry-level for top 1 percent: $385,410/year
- Average earnings of bottom 99 percent: $36,530/year
- Top 1 percent’s share of income in the state: 25.6 percent
10. North Dakota: $1,282,551 per year
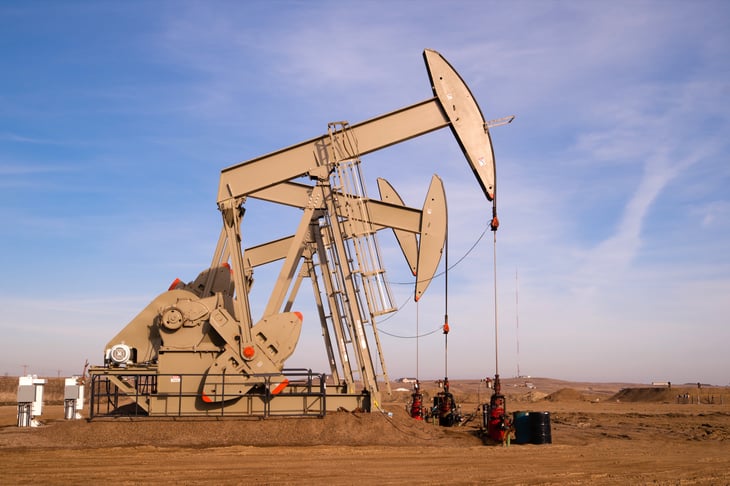
- Entry-level for top 1 percent: $481,492/year
- Average earnings of bottom 99 percent: $61,178/year
- Top 1 percent’s share of income in the state: 17.2 percent
Much of North Dakota’s riches stem from natural resources, including its oil boom in the northwestern part of the state as well as coal, shale gas and wind energy industries.
9. Texas: $1,301,618 per year

Texas has long been a symbol of American wealth. Farming, ranching and, of course, oil traditionally were the backbones of the state’s economy. More recently the state’s wealth has grown from petroleum-related industries, biotech and medical research, aerospace and defense contracting, and an influx of corporate headquarters. The average earnings of the bottom 99 percent are small compared with the $1,301,618, on average, that 1-percenters take home each year, leading to a big wealth gap.
- Entry-level for top 1 percent: $424,507/year
- Average earnings of bottom 99 percent: $48,350/year
- Top 1 percent’s share of income in the state: 21.1 percent
8. Nevada: $1,386,448 per year

- Entry-level for top 1 percent: $311,977/year
- Average earnings of bottom 99 percent: $36,169/year
- Top 1 percent’s share of income in the state: 27.5 percent
7. California: $1,411,375 per year
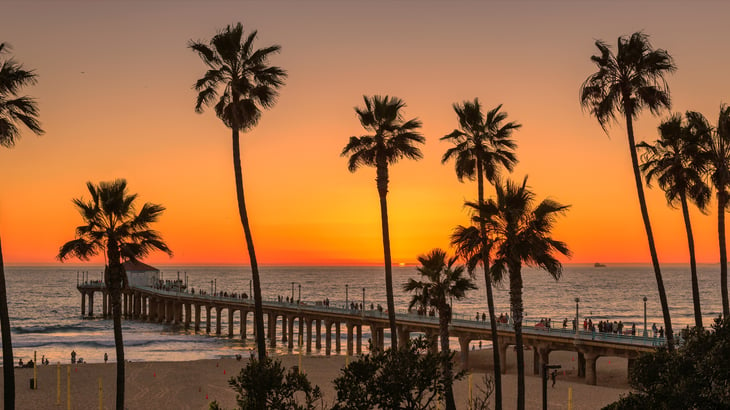
- Entry-level for top 1 percent: $453,772/year
- Average earnings of bottom 99 percent: $48,899/year
- Top 1 percent’s share of income in the state: 22.3 percent
6. New Jersey: $1,453,741 per year

- Entry-level for top 1 percent: $547,737/year
- Average earnings of bottom 99 percent: $57,447/year
- Top 1 percent’s share of income in the state: 20.1 percent
5. District of Columbia: $1,531,432 per year

- Entry-level for top 1 percent: $554,719/year
- Average earnings of bottom 99 percent: $63,100/year
- Top 1 percent’s share of income in the state: 19.4 percent
4. Massachusetts: $1,692,079 per year

- Entry-level for top 1 percent: $539,055/year
- Average earnings of bottom 99 percent: $56,115/year
- Top 1 percent’s share of income in the state: 23 percent
3. New York: $2,006,632 per year

- Entry-level for top 1 percent: $517,557/year
- Average earnings of bottom 99 percent: $44,163/year
- Top 1 percent’s share of income in the state: 31 percent
The biggest gap between the richest 1 percent and everyone else is in New York, where someone in the top tier earns about 45 times more each year than the average New Yorker does.
Inequality is even greater in New York County, including Manhattan and the Financial District.
2. Wyoming: $2,118,167 per year

- Entry-level for top 1 percent: $368,468/year
- Average earnings of bottom 99 percent: $52,196/year
- Top 1 percent’s share of income in the state: 28.7 percent
The biggest wealth gap may be in New York, but the fattest annual earnings among the 1 percent are in — Wyoming. The state may be known for its cowpokes and stunning scenery, but the natural splendors and the potential for privacy and isolation lure a great deal of money to the state.
Jackson, the third-richest small town in Bloomberg’s ranking, lies on the southern border of Yellowstone National Park, spilling from Wyoming into Idaho. Grand Teton National Park and other tourist attractions are nearby, and the area is home to the Jackson Hole Mountain Resort. But it is the extreme wealth of many of its citizens that gives Jackson the dubious distinction of being the most unequal city in the United States.
1. Connecticut: $2,402,339 per year

The gaps between the top 1 percent and the bottom 99 percent are biggest of all in New York and Connecticut. In Connecticut, the wealthiest 1 percent earns 42.6 times what the rest of the state makes, on average. In the United States, the top 1 percent’s average income is 30 times more than the average income of the bottom 99 percent.
After Jackson, Wyoming, the most unequal metro area in the United States is Bridgeport-Stamford-Norwalk, Connecticut, an area known as “the Gold Coast” for its wealth, including health-fund fortunes.
- Entry-level for top 1 percent: $659,979/year
- Average earnings of bottom 99 percent: $56,445/year
- Top 1 percent’s share of income in the state: 29.7 percent


Add a Comment
Our Policy: We welcome relevant and respectful comments in order to foster healthy and informative discussions. All other comments may be removed. Comments with links are automatically held for moderation.