


Editor's Note: This story originally appeared on SmartAsset.com.
A 2019 report from the Federal Reserve on the economic well-being of U.S. households says that only 37% of Americans think that their savings are on track for retirement. The rising costs of living, medical expenses and long-term care can make it difficult to save enough for annual retirement expenses.
With this context in mind, SmartAsset compared data from 100 cities nationwide to identify and rank the places where seniors are the most and least financially secure. This is SmartAsset’s 2021 study on where seniors are most and least financially secure. Read the 2020 version here.
We considered factors including average senior retirement income, percentage of seniors below the poverty line, percentage of seniors on SNAP (the Supplemental Nutrition Assistance Program, formerly called the food stamp program), percentage of seniors who own their homes, percentage of seniors with private retirement income, percentage of seniors who are housing cost-burdened and housing costs as a percentage of senior retirement income.
For details on our data sources and how we put all the information together to create our final rankings, check out the Data and Methodology section at the end.
First, let’s look at where seniors are the most financially secure. Then we’ll look at where seniors are the least financially secure.
1. The Villages, FL
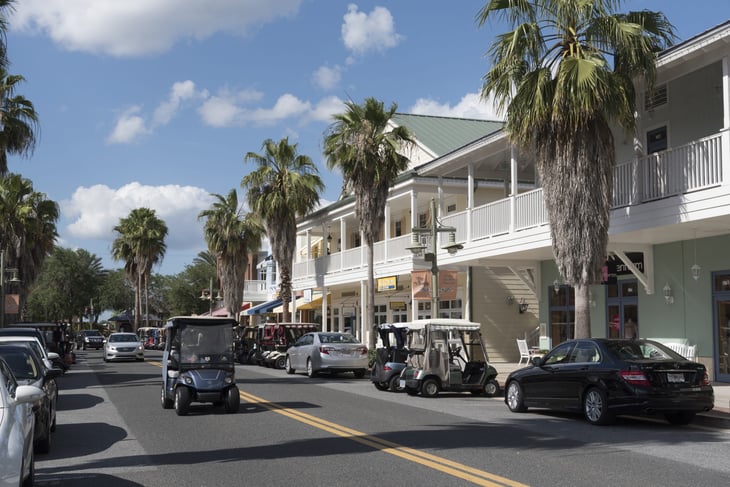
The Villages, an affluent retirement-focused community in central Florida, leads this list. This city ranks first or second in all of our metrics, including having the lowest share of seniors on SNAP, at 0.4%, and leading for the following:
- Percentage of seniors who own their own home: 96.0%
- Percentage of seniors who are cost-burdened by housing: 21.35%
- Housing costs as a percentage of average senior retirement income: 13.95%
2. Surprise, AZ

Only 1.8% of seniors in Surprise, Arizona, are on SNAP, the second-lowest percentage of the cities we studied. This city also has the third-highest number of seniors with private retirement income (63.4%). Surprise ranks fourth-lowest for the percentage of seniors living below the poverty line (5.1%) and percentage of seniors who are housing cost-burdened, and ranks fourth-highest for the percentage of seniors who own their own homes (87.0%).

3. Huntsville, AL

Only 22.61% of seniors in Huntsville, Alabama, are burdened by housing costs, the second-lowest rate for this metric in the study. This city also ranks second-best for relatively low housing costs as a percentage of the city’s average senior retirement income (17.91%). Huntsville places fifth for the retirement income metric, as 60.9% of seniors have some sort of private retirement income flowing in.
4. Anchorage, AK

Anchorage, Alaska, ranks fourth for its average senior retirement income of $63,044. Anchorage also finishes in the top five when it comes to low poverty rates, with 5.5% of seniors living below the poverty line. Roughly 81.5% of seniors there own their homes, the sixth-best rate for this metric overall.
5. Lexington, KY

Only 26.15% of seniors in Lexington, Kentucky, are burdened by housing costs, the third-lowest rate for this metric in the study. The city doesn’t perform as well when it comes to the average senior retirement income (ranking 48th out of 100 at $50,227). But, 56.3% of seniors do have at least some private retirement income, with the city placing eighth for this metric in the study.
Next, we look at where seniors are the least financially secure.
1. Hialeah, FL
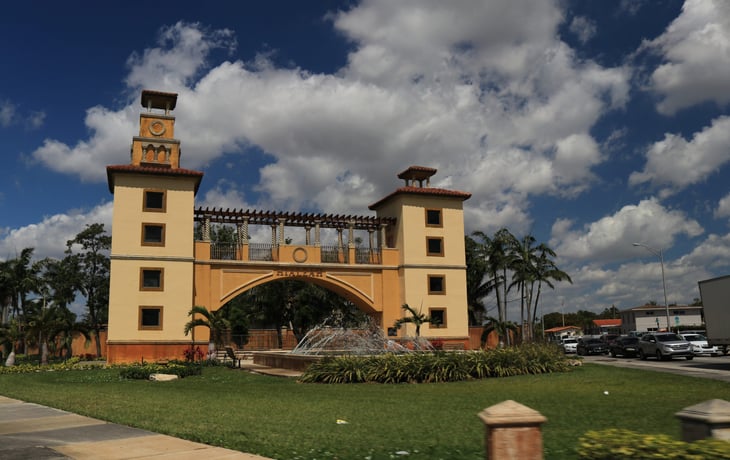
The average retirement income in Hialeah, Florida — a suburb of Miami — is just $27,886, the lowest of all the cities we analyzed. Hialeah also ranks as the least financially secure for its high percentage of seniors on SNAP (51.2%) and housing costs as a percentage of the average senior retirement income (52.67%).
2. Miami, FL
Miami, Florida, a neighbor of Hialeah, is second on this list. Around 31.6% of seniors in Miami are living below the poverty line, the biggest percentage out of the cities we analyzed. Only 17.1% of seniors in Miami have any private retirement income – the lowest percentage for this metric in the study. More than 53% of seniors there are burdened by housing costs, putting Miami second-to-last for that metric.
3. New York, NY

The Big Apple isn’t the best place for financial security for seniors. Only 44.2% of seniors in the city own their homes, the second-lowest rate observed in this study. Nearly 50% of seniors are burdened by housing costs, putting the city 97th out of the 100 cities we studied. Furthermore, 25.8% of seniors are on SNAP, the seventh-highest percentage.
4. Boston, MA

Nearly 21% of seniors in Boston, Massachusetts, are living below the poverty line, the third-highest percentage for this metric in the study. Beantown ranks fourth from the bottom in two categories: the percentage of seniors on SNAP (27.2%) and the percentage of seniors who own their own homes (47.3%).
5. Baltimore, MD

The average retirement income in Baltimore, Maryland, is $41,724, the eighth-lowest out of all the cities we analyzed. Baltimore ranks ninth from the bottom in terms of seniors needing support to buy food, as 21.5% of seniors in the city are on SNAP. Charm City performs somewhat better in terms of how many seniors have some sort of private retirement income, finishing right in the middle at 48.7%.
Data and Methodology

To find the cities where seniors are most and least financially secure, we looked at data for the 100 cities with the largest 65-and-older populations, across the following seven metrics:
- Average senior retirement income. This is private retirement income from savings, IRA, 401(k) plans or pensions, along with Social Security income, for households in which the head of household is 65 or older.
- Percentage of seniors below the poverty line. This is the percentage of seniors who live below the federal poverty line.
- Percentage of seniors who receive food stamps. This is the percentage of households that receive food stamps or SNAP benefits for households in which the head of household is 65 or older.
- Percentage of seniors who own their homes. This is the percentage of households in which the head of household is 65 or older and the residents own their home.
- Percentage of seniors with private retirement income. This is the percentage of households in which the head of household is 65 or older that have retirement income from private means. This includes money from income streams such as annuities, insurance, IRAs and retirement pensions.
- Percentage of seniors who are housing cost-burdened. This is the percentage of households in which the head of household is 65 or older and that spend 30% or more of income on housing costs. This includes both owners and renters.
- Housing costs as a percentage of average senior retirement income. This is the median annual housing cost divided by the average senior retirement income, from both private means along with Social Security income.
Data for all metrics comes from the U.S. Census Bureau’s 2019 5-year American Community Survey.
First, we ranked each city in each metric. Then we found each city’s average ranking, assigning each metric an equal weight. Using this average ranking, we created our final score. The city with the highest average ranking received a score of 100. The city with the lowest average ranking received a score of 0.
Add a Comment
Our Policy: We welcome relevant and respectful comments in order to foster healthy and informative discussions. All other comments may be removed. Comments with links are automatically held for moderation.