


This story originally appeared on SmartAsset.com.
According to the U.S. Department of Housing and Urban Development, a household that spends more than 30% of its combined income on housing is considered “cost-burdened.” And households spending over 50% on housing are considered “severely cost-burdened.” Many homeowners nationwide facing constraints based on their housing expense ratio may need to rethink their housing budget and move forward with a different personal finance plan. Some cities are more affected than others, however, which is why SmartAsset decided to take a closer look at the data to identify the cities with the most and fewest of these cost-burdened homeowners.
In order to do this, we compared the total number of homeowner households with the number of these households spending 50% or more on housing, as well as the number of these households spending between 30% and 50% of their income on housing. We used these numbers to find the percentage that fits into each category. For details on our data sources and how we put all the information together to create our final rankings, check out the Data and Methodology section at the end.
This is SmartAsset’s fifth study on this topic. Check out our 2020 version here.
The 10 Most Severely Housing Cost-Burdened Cities
1. Los Angeles, CA
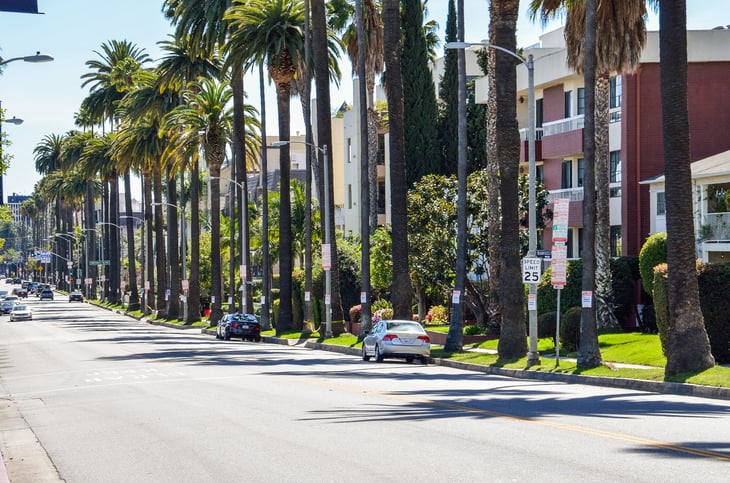
There are 511,115 homeowner households in the City of Angels, and 93,475 of those pay between 30% and 50% of their income on housing costs. Another 95,584 spend at least 50% of their income on housing. This means that 36.99% of owner-occupied households are housing cost-burdened there, and 18.70% are severely cost-burdened.
2. Miami, FL

Miami has 55,878 owner-occupied households, and 20,186 of those are burdened by housing costs, totaling just over 36% of all homes. Another 10,307 of these homes pay at least 50% of their income in housing costs, accounting for 18.45%.
3. New York, NY
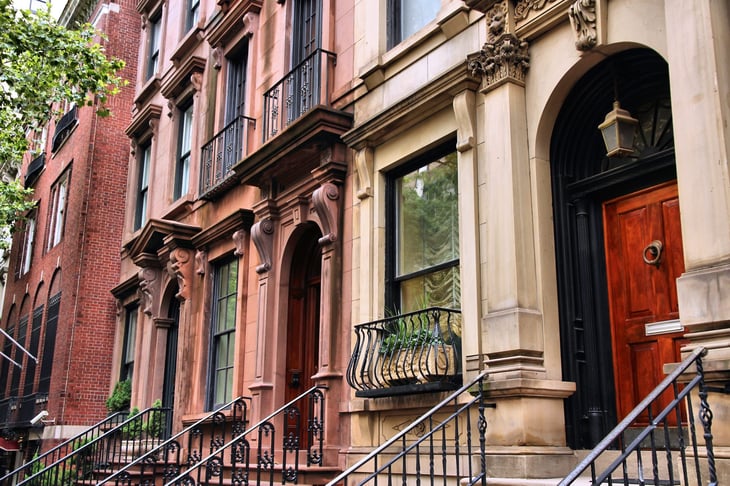
It’s no secret that the Big Apple is expensive. Out of 1,022,819 homeowner households in the city, 326,439 are cost-burdened, accounting for 31.92%. Another 167,589 owner-occupied homes in New York City spend at least 50% of their income on housing, making up 16.38% of all owner-occupied homes.
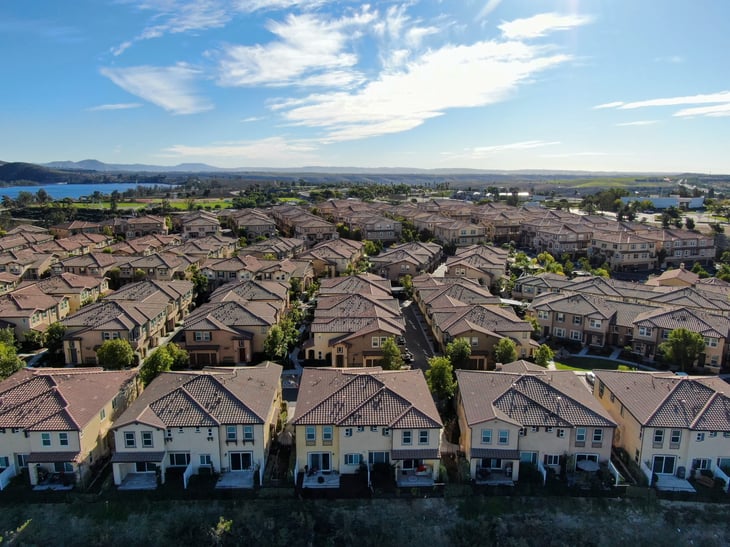
4. Oceanside, CA

In this city near San Diego, 36.65% of Oceanside’s 37,426 owner-occupied homes are burdened by housing costs. Another 5,651 homeowner households pay more than 50% of their income on housing, which accounts for 15.17% of all owner-occupied homes.
5. Long Beach, CA

This Southern California city has 64,944 homeowner households, and 32.43% of those spend at least 30% of their income on housing costs. Those with a severe housing cost-burden make up 14.09% of all Long Beach owner-occupied homes.
6. New Orleans, LA

The Big Easy isn’t always easy to afford. More than 28% of the city’s 75,257 homeowner households spend at least 30% of their income on housing costs. And another 13.95%, made up of 10,498 owner-occupied households, spend at least 50% of their income on housing costs.
7. Irvine, CA

This Orange County suburb has 45,526 homeowner households, and 7,704 of those spend between 30% and 50% of their income on housing. Another 6,177 owner-occupied homes are severely cost-burdened, paying more than 50% of their income on housing costs.
8. San Francisco, CA

San Francisco has 135,852 homeowner households, and 28.92% of them pay at least 30% of their income on housing costs. Another 18,426 homeowner households spend at least 50% of their income on housing costs, meaning that 13.56% of the owner-occupied homes in the city are severely housing cost-burdened.
9. Fort Lauderdale, FL
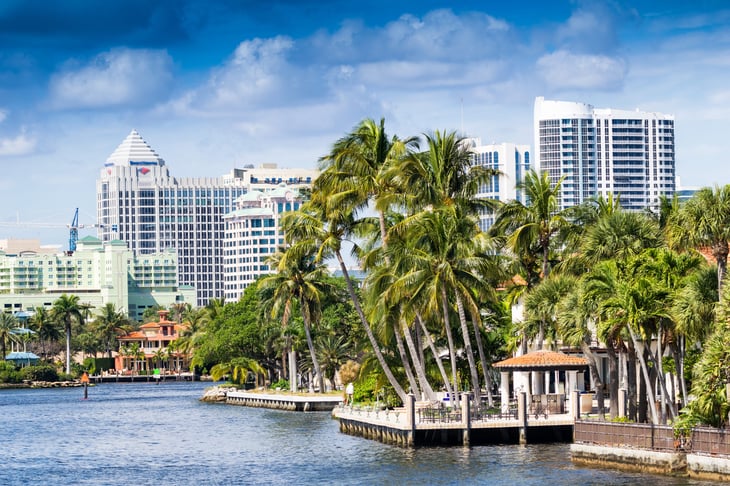
About 29% of the 41,612 homeowner households in this South Florida city spend between 30% and 50% of their income on housing costs. And another 5,572 (13.39%) are severely cost-burdened, spending at least 50% of their income on housing.
10. Chula Vista, CA
Chula Vista, California, rounds out the top 10. Almost 34% of 49,726 homeowner households there are housing cost-burdened, paying at least 30% of their income on housing costs. Another 6,593 homeowner households (13.26%) are severely cost-burdened, spending at least 50% of their income on housing.
The 10 Least Severely Housing Cost-Burdened Cities
1. Raleigh, NC

Raleigh, North Carolina, has 96,410 homeowner households, and only 3.83% of those (3,688 homes) are severely cost-burdened. Another 15.27% of total owner-occupied homes pay at least 30% of their income on housing costs.

2. Lincoln, NE

This Nebraska state capital and college town has 67,511 homeowner households, and 14.83% of those are spending between 30% and 50% of their income on housing. Only 4.75% are severely cost-burdened, spending 50% or more of their income on housing.
3. Overland Park, KS
Overland Park, Kansas, has 51,660 homeowner households, and 16.12% of those are spending at least 30% of their income on housing. Only 4.79% are severely cost-burdened, paying at least 50%.
4. Lexington, KY

Lexington, Kentucky, has 70,322 homeowner households, and 16.86% of those pay at least 30% of their income on housing costs. Only 4.84% of these households are paying at least 50% of their income on housing.
5. Gilbert, AZ

Located in Maricopa County, Gilbert has 61,517 homeowner households, and 17.26% of those spend between 30% and 50% of their income on housing costs. Only 5.75% pay at least 50% of their household income on housing.
6. Madison, WI

This state capital and college town has 52,400 owner-occupied households, and 16.87% of those are burdened by housing costs. Only 5.76% are severely burdened, spending at least 50% of their income on housing.
7. Dothan, AL

Dothan, Alabama, is the smallest city in our study, with 15,891 owner-occupied households. Of those, only 15.30% are burdened by housing costs, and just 5.87% are severely burdened.
8. Columbus, OH

Columbus, Ohio, is the largest city in the bottom 10, with 167,715 total homeowner households. Cost-burdened homes add up to 18,835, 17.37% of total owner-occupied homes. And 6.14% are severely burdened, spending at least 50% of their income on housing.
9. St. Paul, MN

St. Paul, Minnesota, has 57,817 homeowner households, and 3,555 of those (6.15% out of total owner-occupied homes) are severely cost-burdened. Another 19.79% (7,887 homes) pay at least 30% of their income on housing costs.
10. Vancouver, WA

Vancouver, Washington, rounds out the bottom 10. With 36,433 homeowner households, 22.50% pay at least 30% of their income on housing costs, and only 6.21% pay at least 50%.

Data and Methodology

To find where homeowners in the U.S. are the most and least severely housing cost-burdened, we examined 106 cities that had data available. For each of these cities, we found the total number of homeowner households, the number of homeowner households spending between 30% and 50% of their income on housing, and the number of homeowner households spending more than 50% of their income on housing.
We took the number of homeowner households in each city paying more than 50% of their income on housing and divided it by the total number of homeowner households in that city in order to calculate the percentage of households that are severely housing cost-burdened. We then ranked each city based on this percentage. We also calculated the percentage of these households in each city paying more than 30% of their income on housing, but this did not impact the ranking.
Data comes from the U.S. Census Bureau 2019 1-year American Community Survey.
Add a Comment
Our Policy: We welcome relevant and respectful comments in order to foster healthy and informative discussions. All other comments may be removed. Comments with links are automatically held for moderation.