
This story originally appeared on SmartAsset.com.
People choose where to live based on many factors — the availability of jobs, location of family, and weather all come into play for most folks. Something some Americans may not remember to take into consideration, though, is the livability of a city. While this can be hard to quantify, SmartAsset has tried to do just that, comparing cities across the country to find the most livable places in 2020.
We ran the numbers on 100 of the largest cities in the U.S. to see how they stacked up across the following metrics: walk score, violent crime rate, property crime rate, unemployment, housing costs as percentage of income, and the rate of housing cost-burden. For details on our data sources and how we put all the information together to create our final rankings, check out the Data and Methodology section at the end.
This is SmartAsset’s second study on the most livable cities in the U.S. Check out the 2019 edition here.
1. Arlington, VA

Arlington, Virginia, located right outside of Washington, D.C., is the most livable city in America in this year’s edition of our study. Arlington has been our most livable city since 2017. It has the second-lowest property crime rate (1,298 incidents per 100,000 residents) and the fourth-lowest violent crime rate (138 incidents per 100,000 residents) in our study. It also has a September 2020 unemployment rate of just 4.5%, the fourth-lowest rate in the study.
2. Boise, ID

Boise, Idaho, saw just 283 incidents of violent crime per 100,000 residents in 2019, the 13th-lowest rate for this metric in the study. It comes in seventh for property crime, at just 1,595 per 100,000 residents. Only 28% of residents of Boise are burdened by their housing cost, making it the seventh-least housing cost-burdened city we analyzed.
3. Lincoln, NE

Lincoln, Nebraska, had the lowest unemployment rate in our study for September 2020, at just 3.2%. Lincoln also ranks fourth for both of the housing costs metrics we tested, with housing costs representing 18.96% of income and 27% of residents being housing cost-burdened. That said, it isn’t the easiest place to access all your needs by foot, as it ranks in the middle of the study in terms of walk score.
4. Gilbert, AZ

Gilbert is the first of four Arizona locales to make the top 10 of this study. It has the lowest number of property crimes across all 100 cities we examined (1,200 per 100,000 residents) and the second-fewest number of violent crimes (96 per 100,000 residents). On the downside, the city ranks in the bottom 10 of the study for walkability, but Gilbert is relatively affordable, coming in first for both housing costs as a percentage of income (18.75%) and the percentage of residents who are housing cost-burdened (22.0%).
5. Plano, TX
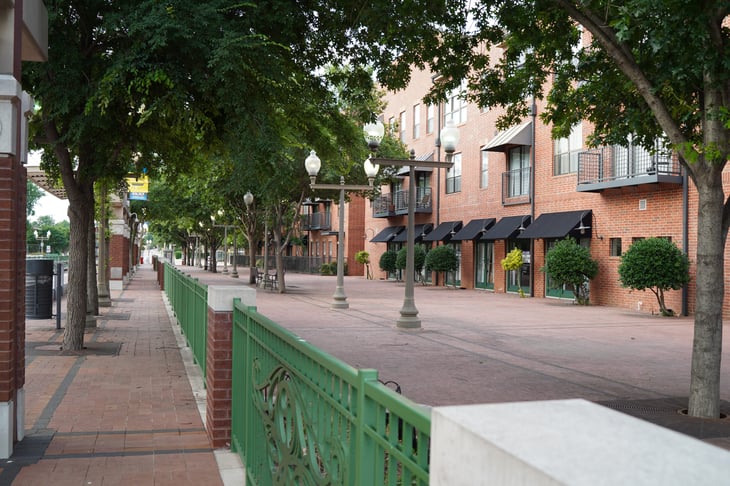
Housing costs in Plano, Texas, represent 20.02% of income, ranking eighth-lowest in this study. It also scores in the top 10 for its low rates in both of the crime statistics we considered. In 2019, there were 151 violent crime incidents (fifth-lowest) and 1,717 property crime incidents (10th-lowest) in the city per 100,000 residents.
6. Chandler, AZ

Chandler is the second city in Arizona to make the top 10 of this study. Like some of the other Arizona cities in the top 10, Chandler does not fare very well for walkability, ranking in the bottom quartile. However, it has the third-lowest percentage of housing cost-burdened residents among the 100 cities we analyzed, at 26%. Furthermore, housing costs make up 19.87% of income on average, the seventh-lowest percentage in this study.
7. Madison, WI
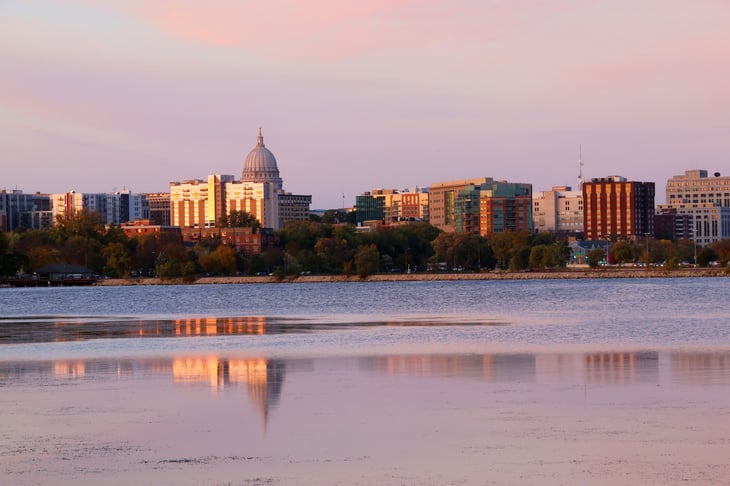
Madison, Wisconsin, had an unemployment rate of 3.8% in September 2020, the second-lowest in this study. Madison also finished in the top third of the 100 cities on this list for every other metric but one (housing costs as a percentage of income, for which it ranked 41st). It had the 21st-lowest number of violent crime incidents overall (362 per 100,000 residents in 2019) and the 28th-lowest rate of housing-cost burden, at 31.7%.
8. Scottsdale, AZ

The third Arizona city to place in the top 10 is Scottsdale, where there were just 161 incidents of violent crime per 100,000 residents in 2019, the sixth-lowest rate of the 100 cities we analyzed. Scottsdale also finishes 13th for both of the housing cost metrics we measured: Housing costs represent 20.54% of income, and 29.4% of residents are housing cost-burdened.
9. Raleigh, NC

Raleigh, North Carolina, finishes in the top 15 for both safety metrics: It had 257 incidents of violent crime per 100,000 residents (12th-fewest in this study) and 1,795 incidents of property crime per 100,000 residents (14th-fewest in this study). Raleigh finishes 17th for its relatively low September 2020 unemployment rate (6.1%) and housing costs as a percentage of income (21.01%).
10. Mesa, AZ

The final city in the top 10 is the fourth Arizona city to make the list, Mesa. Mesa finishes in the top quartile of cities in every metric except one — walk score, for which it comes in 73rd place. The top quartile rankings, though, include Mesa’s 13th-place finish for its low rate of housing cost-burden, at 29.4%, and its 15th-place finish in terms of property crime rate, at just 1,869 per 100,000 residents for 2019.
Data and Methodology

To find the most livable cities in the U.S., we analyzed data on 100 of the largest cities in the country. We examined each city according to the following seven metrics:
- Walkability. This is calculated on a 0 to 100 scale. A lower number means the city is less walkable while a higher number means it is more walkable. Data comes from walkscore.com.
- Violent crime rate. This is the violent crime rate per 100,000 residents. Data comes from the 2019 FBI Uniform Crime Reporting Database for all reporting cities. For non-reporting cities, data comes from neighborhoodscout.com.
- Property crime rate. This is the property crime rate per 100,000 residents. Data comes from the 2019 FBI Uniform Crime Reporting Database for all reporting cities. For non-reporting cities, data comes from neighborhoodscout.com.
- Unemployment rate. September 2020 data comes from the Bureau of Labor Statistics (BLS) and is reported at the county level.
- Housing costs as a percentage of income. This is the median housing costs divided by median household income. Data comes from the Census Bureau’s 2019 1-year American Community Survey.
- Housing cost-burdened rate. This is the percentage of households spending 30% or more of their income on housing. Data comes from the Census Bureau’s 2019 1-year American Community Survey.
First, we ranked each city in every metric. We then found each city’s average ranking, giving each metric a full weight. We used this average ranking to determine a final score. The city with the best average ranking received a score of 100 and the city with the lowest received a score of 0.


Add a Comment
Our Policy: We welcome relevant and respectful comments in order to foster healthy and informative discussions. All other comments may be removed. Comments with links are automatically held for moderation.