


Editor's Note: This story originally appeared on SmartAsset.com.
The Bureau of Transportation Statistics says that Americans spent $1.4 trillion on transportation costs in 2019. According to a Bureau of Labor Statistics (BLS) Consumer Expenditure Survey for the same year, transportation is the second-highest household spending category after housing.
In some parts of the country, households spend a larger portion of their income on transportation than in others.
Keeping this in mind, SmartAsset crunched the numbers to identify and rank the metro areas where people are spending the highest percentage of their income on transportation costs. This is SmartAsset’s second study on where people are spending the most on transportation. Check out the 2019 version of the study here.
We considered the average transportation spending and average household income for 22 metro areas throughout the U.S. For details on our data sources and how we put all the information together to create our final rankings, check out the data and methodology section at the end.
1. Tampa, FL
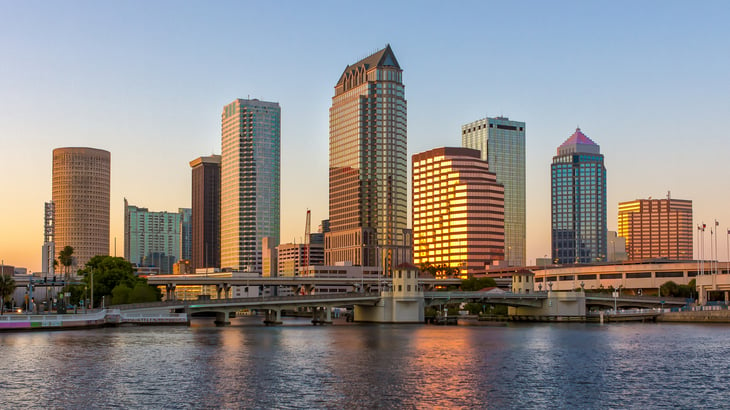
Residents of the Tampa, Florida, metro area spent 17% of their annual income on transportation costs each year, averaging $10,692 in real dollars.
The majority of that is spent on vehicle costs, including vehicle purchases, gas, motor oil and other expenses.
Residents of this metro area spend $9,949 — or 15.82% of their income — each year on vehicle costs (the highest figure for this statistic across the study).
2. Phoenix, AZ
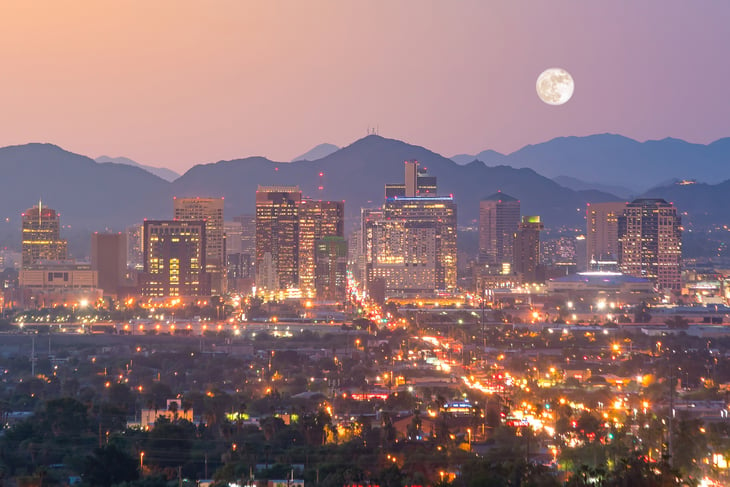
Phoenix, Arizona, is a close second in this study. Residents here spend 16.78% of the average household income ($74,635) on transportation costs, which adds up to a total of $12,525.
Cars in this metro area are the most common mode of transportation, with 15.80% of the average annual income in Phoenix going to car costs (the second-highest across all 22 metro areas in the study).

3. Miami, FL

Residents of this South Florida metro area spend 14.79% of their average household income ($73,793) on transportation costs.
That’s an average expense of $10,915. Miami is another car-centric locale, with an average of 13.76% of income spent on auto costs (ranking third in this study).
4. Anchorage, AK

Anchorage, Alaska, is second only to the New York City metro area when it comes to the percentage of income that is spent on public transportation (1.69%) each year.
Residents here pay an average of $1,594 each year on public transportation. Total transportation averages $13,313 annually, which is 14.13% of the median income.
5. Detroit, MI
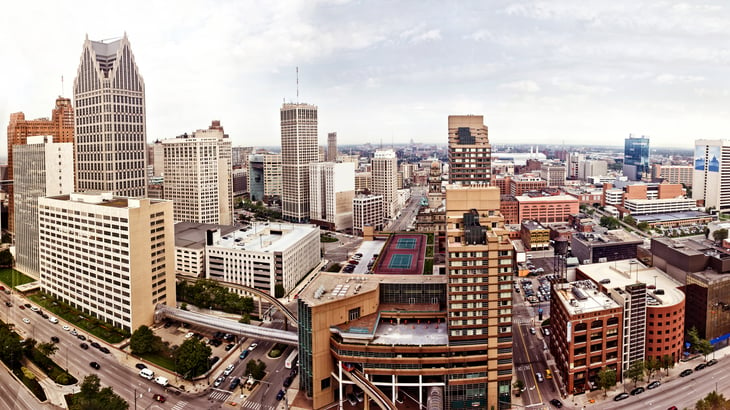
Residents in the Detroit, Michigan, metropolitan area spend 12.91% of their average household income ($87,214) on transportation.
Nearly all of that comes from auto expenses, which amount to $10,557 each year for the average household (or 12.10% of their total income).
6. Houston, TX

Houston, Texas, area residents rank seventh in this study for auto costs, spending 11.44% of their average income on vehicle expenses.
This metro area also has the sixth-highest total public transportation costs as a percentage of income (1.37%). Residents pay 12.80% of their average household income on both public transportation and vehicle expenses.
7. St. Louis, MO
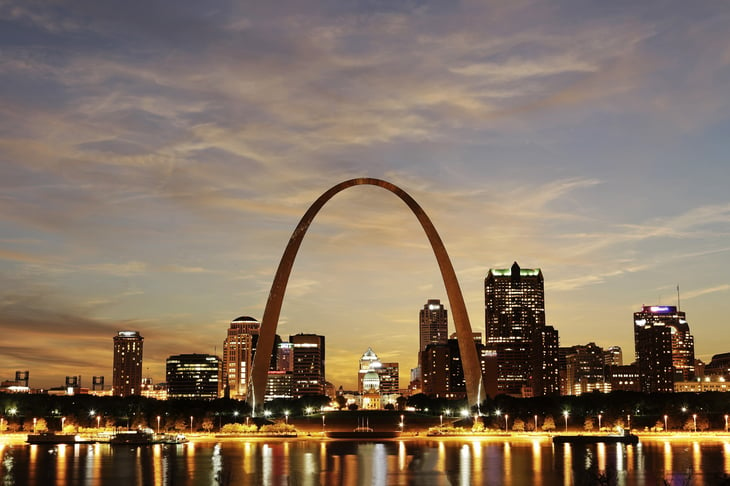
The St. Louis, Missouri, metro area has the lowest public transportation spending as a percentage of income across the study, as residents spend only 0.78% of their average income ($88,772) on it.
By comparison, they pay much more for their automobiles, which accounts for 11.75% of their average income. Combined, they spend an average of $11,123 on both auto expenses and public transportation — 12.53% of income.
8. Los Angeles, CA
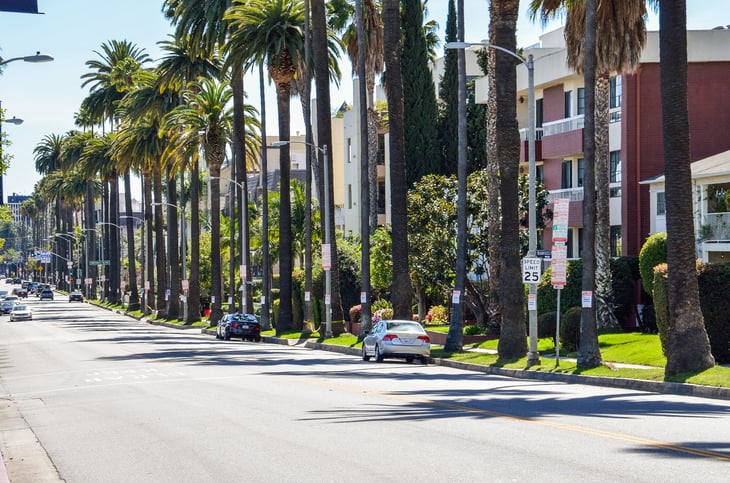
Los Angeles, California, metro area residents pay most of their transportation costs on automobiles.
Angelenos spend 12.17% of their average income ($90,037) on transportation costs, and only 1.01% of this goes toward public transport.
9. San Diego, CA
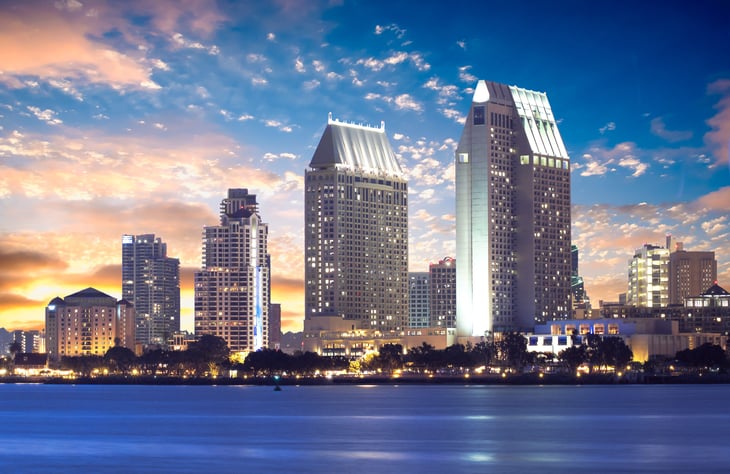
Residents in the San Diego, California, metro area spend an average of 11.96% of their household income ($97,853) on transportation costs.
Public transportation accounts for only 1.54% of income (the fourth-highest across all 22 metro areas in the study).
10. Dallas-Fort Worth, TX

Dallas-Fort Worth, Texas, residents spend 11.71% of their average household income ($89,438) on transportation costs.
This includes 10.76% on auto-related costs and 0.95% on public transportation.
Data and Methodology

In order to find the places where people spend the most on transportation, we looked at data for 22 metro areas included in the Bureau of Labor Statistics (BLS) 2018-2019 Consumer Expenditure Survey. Specifically, we looked at data for the following metrics:
- Average transportation spending. This is the annual amount that the average household spends on transportation (including vehicle expenses, gasoline, and public transportation). Data is from the BLS 2018-2019 Consumer Expenditure Survey.
- Average household income. This is the annual average household income. Data is from the BLS 2018-2019 Consumer Expenditure Survey.
We divided the average transportation spending in each metro area by the average household income in that area.
The result represents the average transportation spending as a percentage of total income. We ranked the places according to those percentages, from highest to lowest.
Add a Comment
Our Policy: We welcome relevant and respectful comments in order to foster healthy and informative discussions. All other comments may be removed. Comments with links are automatically held for moderation.