


Editor's Note: This story originally appeared on Filterbuy.
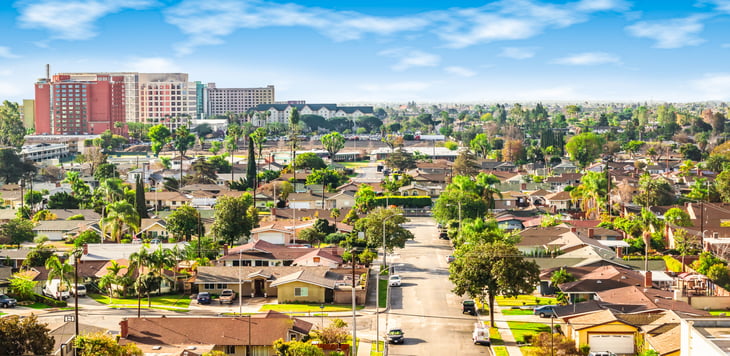
Housing prices in the U.S. have been on a steep upward trajectory over the last year and are continuing to climb.
Unusual economic conditions, strong demand for homes, and record low inventory have made the residential real estate market highly competitive and sent prices skyrocketing.
According to data from the Department of Housing and Urban Development, the average sale price of a home in the U.S. rose nearly 16% between the second quarter of 2020 and second quarter of 2021 — one of the greatest year-over-year increases on record.
The good news is that a majority (58.3%) of owner-occupied households currently spend less than 20% of their income on housing, according to the U.S. Census Bureau.
However, this leaves more than 40% of homeowners spending above that amount, with more than 1 in 5 homeowners spending 30% or higher.
The data used in this analysis is from the Census Bureau, Zillow, and the U.S. Bureau of Economic Analysis.
To determine the locations where homeowners spend the most on housing, researchers at Filterbuy calculated median monthly housing costs as a share of median monthly income for each location. In the event of a tie, the location with the higher median monthly housing costs was ranked higher.
Here are the large cities (population of 350,000 or more) where homeowners spend the most on housing relative to income.
15. Sacramento, CA

Median monthly housing costs as a share of income: 19.6%
Median monthly housing costs: $1,526
Median monthly household income: $7,774
Current median home price: $449,788
Overall cost of living: +5.2%
14. Chicago, IL

Median monthly housing costs as a share of income: 19.7%
Median monthly housing costs: $1,528
Median monthly household income: $7,775
Current median home price: $299,929
Overall cost of living: +2.8%

13. San Jose, CA

Median monthly housing costs as a share of income: 19.8%
Median monthly housing costs: $2,509
Median monthly household income: $12,659
Current median home price: $1,286,076
Overall cost of living: +26.7%
12. Portland, OR

Median monthly housing costs as a share of income: 19.9%
Median monthly housing costs: $1,746
Median monthly household income: $8,783
Current median home price: $552,071
Overall cost of living: +5.0%
11. New York, NY

Median monthly housing costs as a share of income: 20.3%
Median monthly housing costs: $1,812
Median monthly household income: $8,909
Current median home price: $660,230
Overall cost of living: +25.7%
10. Aurora, CO

Median monthly housing costs as a share of income: 20.5%
Median monthly housing costs: $1,498
Median monthly household income: $7,322
Current median home price: $447,686
Overall cost of living: +4.2%
9. New Orleans, LA

Median monthly housing costs as a share of income: 20.6%
Median monthly housing costs: $1,164
Median monthly household income: $5,645
Current median home price: $259,398
Overall cost of living: -6.9%
8. Fresno, CA

Median monthly housing costs as a share of income: 21.0%
Median monthly housing costs: $1,347
Median monthly household income: $6,400
Current median home price: $326,544
Overall cost of living: -2.5%
7. San Francisco, CA

Median monthly housing costs as a share of income: 21.4%
Median monthly housing costs: $2,701
Median monthly household income: $12,638
Current median home price: $1,502,029
Overall cost of living: +34.5%
6. Long Beach, CA

Median monthly housing costs as a share of income: 21.5%
Median monthly housing costs: $1,933
Median monthly household income: $8,976
Current median home price: $8,976
Overall cost of living: +18.8%
5. Oakland, CA

Median monthly housing costs as a share of income: 21.6%
Median monthly housing costs: $2,253
Median monthly household income: $10,425
Current median home price: $959,760
Overall cost of living: +34.5%
4. San Diego, CA

Median monthly housing costs as a share of income: 22.0%
Median monthly housing costs: $2,149
Median monthly household income: $9,755
Current median home price: $849,192
Overall cost of living: +17.9%
3. Anaheim, CA
Median monthly housing costs as a share of income: 22.7%
Median monthly housing costs: $2,095
Median monthly household income: $9,218
Current median home price: $777,598
Overall cost of living: +18.8%
2. Miami, FL

Median monthly housing costs as a share of income: 23.9%
Median monthly housing costs: $1,313
Median monthly household income: $5,488
Current median home price: $414,625
Overall cost of living: +11.7%
1. Los Angeles, CA

Median monthly housing costs as a share of income: 25.0%
Median monthly housing costs: $2,286
Median monthly household income: $9,160
Current median home price: $898,692
Overall cost of living: +18.8%
Methodology

The data used in this analysis is from the U.S. Census Bureau’s 2019: ACS 1-Year Estimates Subject Tables, Zillow’s Housing Data, and the U.S. Bureau of Economic Analysis Regional Price Parities dataset.
To determine the locations where homeowners spend the most on housing, researchers calculated the median monthly housing costs as a share of income for each location. In the event of a tie, the location with the higher median monthly housing costs was ranked higher.
To improve relevance, only cities with at least 100,000 residents were included.
Add a Comment
Our Policy: We welcome relevant and respectful comments in order to foster healthy and informative discussions. All other comments may be removed. Comments with links are automatically held for moderation.