


This story originally appeared on Construction Coverage.
Despite decades of record-setting home sales, owning a home has become increasingly difficult for the average worker. Mortgage interest rates are historically low, yet hourly earnings have failed to keep pace with rising housing costs.
Data from the federal government indicates that although earnings for production and nonsupervisory workers increased by approximately 80 percent between January 2000 and April 2020, housing costs have nearly doubled during the same period.
The rise in home prices over the past several years has occurred during a period of increased housing demand — driven by a growing economy and more millennial homebuyers — as well as a shortage of new, single-family homes available for purchase.
At the same time that home prices have gone up, wages for the average worker have failed to keep pace. Research from the Economic Policy Institute shows that while wages for high-income workers grew steadily since the 1980s, middle- and low-income workers have actually seen their wages stagnate or even decline after adjusting for inflation.
To identify metropolitan areas with the greatest rise in home prices relative to income, researchers at Construction Coverage, a review website for builders insurance and worker’s compensation insurance, analyzed data from Zillow and the U.S. Bureau of Labor Statistics. For each metro, the percentage change in home price between 2014 and 2019 was divided by the percentage change in median wage during the same time period.

Home price statistics are from the Zillow Home Value Index, which includes all single-family residences, condos, and co-ops. Wage statistics are from the U.S. Bureau of Labor Statistics Occupational Employment Survey, which includes all full-time and part-time wage and salary workers in nonfarm establishments. The data do not include self-employed workers, owners and partners in unincorporated firms, household workers, or unpaid family workers.
To identify metros with the largest increase in home prices relative to income over the past five years, researchers calculated the percentage change in home prices and the percentage change in median annual wages between 2014 and 2019. The percentage change in home price was then divided by the percentage change in wages. Locations were ordered by the resulting statistic. In the event of a tie, locations with the larger percentage increase in home price were ranked higher.
Here are the large metros with the largest increases in home prices relative to income.
15. Jacksonville, Florida

- Increase in home prices relative to income: 3.1X
- 5-year percentage change in home prices: 36.4%
- 5-year percentage change in wages: 11.6%
- Median home price (2019): $228,585
- Median annual wage (2019): $36,770
14. Phoenix-Mesa-Scottsdale, Arizona

- Increase in home prices relative to income: 3.1X
- 5-year percentage change in home prices: 37.5%
- 5-year percentage change in wages: 12.1%
- Median home price (2019): $279,459
- Median annual wage (2019): $39,420
13. Columbus, Ohio

- Increase in home prices relative to income: 3.1X
- 5-year percentage change in home prices: 38.4%
- 5-year percentage change in wages: 12.2%
- Median home price (2019): $206,561
- Median annual wage (2019): $40,380
12. Kansas City, Missouri-Kansas

- Increase in home prices relative to income: 3.2X
- 5-year percentage change in home prices: 36.4%
- 5-year percentage change in wages: 11.3%
- Median home price (2019): $201,466
- Median annual wage (2019): $40,640
11. Grand Rapids-Wyoming, Michigan
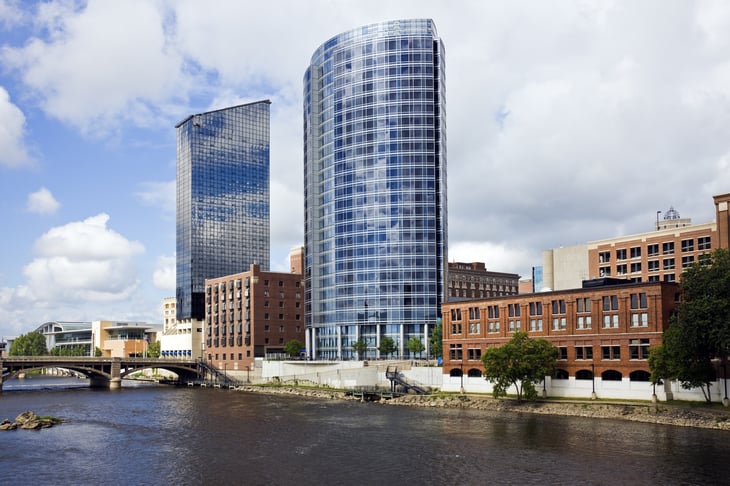
- Increase in home prices relative to income: 3.3X
- 5-year percentage change in home prices: 47.1%
- 5-year percentage change in wages: 14.3%
- Median home price (2019): $214,581
- Median annual wage (2019): $37,410
10. Tampa-St. Petersburg-Clearwater, Florida
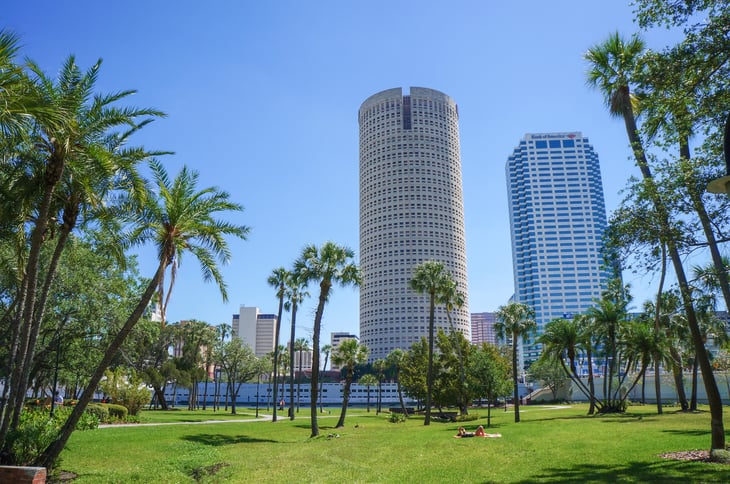
- Increase in home prices relative to income: 3.5X
- 5-year percentage change in home prices: 48.9%
- 5-year percentage change in wages: 13.8%
- Median home price (2019): $224,850
- Median annual wage (2019): $37,170
9. Detroit-Warren-Dearborn, Michigan

- Increase in home prices relative to income: 3.6X
- 5-year percentage change in home prices: 41.8%
- 5-year percentage change in wages: 11.7%
- Median home price (2019): $179,796
- Median annual wage (2019): $41,620
8. Atlanta-Sandy Springs-Roswell, Georgia

- Increase in home prices relative to income: 3.6X
- 5-year percentage change in home prices: 42.4%
- 5-year percentage change in wages: 11.7%
- Median home price (2019): $236,369
- Median annual wage (2019): $40,000
7. Nashville-Davidson-Murfreesboro-Franklin, Tennessee

- Increase in home prices relative to income: 3.6X
- 5-year percentage change in home prices: 48.8%
- 5-year percentage change in wages: 13.6%
- Median home price (2019): $273,539
- Median annual wage (2019): $38,900
6. Dallas-Fort Worth-Arlington, Texas

- Increase in home prices relative to income: 3.7X
- 5-year percentage change in home prices: 50.4%
- 5-year percentage change in wages: 13.5%
- Median home price (2019): $250,511
- Median annual wage (2019): $40,430
5. Sacramento-Roseville-Arden-Arcade, California

- Increase in home prices relative to income: 3.8X
- 5-year percentage change in home prices: 35.2%
- 5-year percentage change in wages: 9.4%
- Median home price (2019): $419,012
- Median annual wage (2019): $44,590
4. Salt Lake City, Utah

- Increase in home prices relative to income: 3.9X
- 5-year percentage change in home prices: 46.9%
- 5-year percentage change in wages: 12.1%
- Median home price (2019): $372,843
- Median annual wage (2019): $40,120
3. San Jose-Sunnyvale-Santa Clara, California

- Increase in home prices relative to income: 4.6X
- 5-year percentage change in home prices: 36.3%
- 5-year percentage change in wages: 7.9%
- Median home price (2019): $1,149,093
- Median annual wage (2019): $61,980
2. Charlotte-Concord-Gastonia, North Carolina-South Carolina

- Increase in home prices relative to income: 4.6X
- 5-year percentage change in home prices: 40.3%
- 5-year percentage change in wages: 8.7%
- Median home price (2019): $230,443
- Median annual wage (2019): $39,230
1. Las Vegas-Henderson-Paradise, Nevada

- Increase in home prices relative to income: 6.8X
- 5-year percentage change in home prices: 51.0%
- 5-year percentage change in wages: 7.5%
- Median home price (2019): $289,885
- Median annual wage (2019): $35,660
Add a Comment
Our Policy: We welcome relevant and respectful comments in order to foster healthy and informative discussions. All other comments may be removed. Comments with links are automatically held for moderation.