


Editor's Note: This story originally appeared on Outdoorsy.
Unlike other segments of the travel and tourism economy, the market for recreational vehicles has been thriving in the face of COVID-19. Compared to other travel options like flying or staying in a hotel, traveling by RV makes it easier to maintain physical distance and lower the risk of exposure to the coronavirus.
Early indications are that the appeal of RVs has continued to grow during the pandemic, and industry experts are anticipating a nearly 25% surge in RV shipments in 2021.
But the increased demand for RVs is not surprising, as the market has been growing consistently over the last decade. For example, according to a recent U.S. Census Bureau report, RV dealership sales increased by more than 81% between 2012 and 2017, the most recent year for which census data is available. The market has been driven by an aging population, as more baby boomers hit the road in retirement, but also by strong interest among millennials and Gen Z consumers interested in camping and outdoor experiences.
This increase in demand has also presented an opportunity for dealers to get into the RV business. As shipments have grown, the number of dealers has also seen a steady increase over the past decade, according to Census Bureau data. In 2012, the industry had 2,625 U.S. dealers; that number grew to 2,703 in 2018.
To find the metros with the highest levels of RV spending, researchers at Outdoorsy used data from the U.S. Census Bureau and calculated per capita annual sales at RV dealerships. The researchers also calculated total annual sales at RV dealers for each metro, along with data on the relative density of RV dealers in the area, median income, and metro population for comparison purposes.
Here are the large metropolitan areas (populations of 750,000 or more) with the most RV sales per capita.
15. Albany-Schenectady-Troy, NY

- Per capita annual sales at RV dealers: $127
- Annual sales at RV dealers: $111,374,000
- Density of RV dealers (compared to average): +3.6%
- Median household income: $73,398
- Population: 880,381
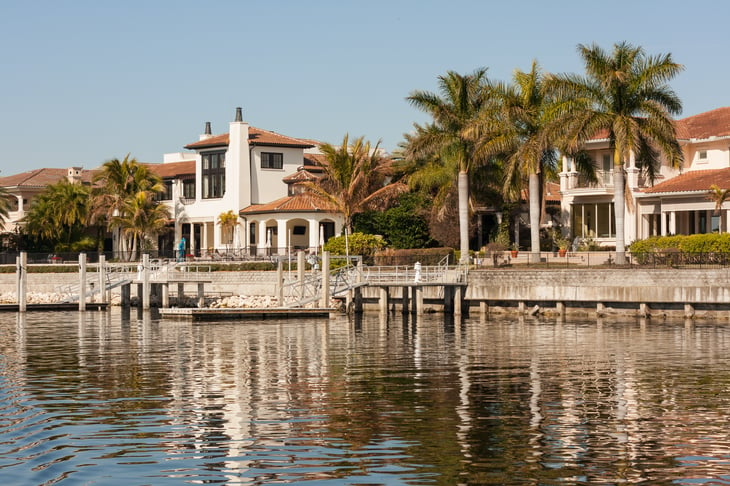
14. North Port-Sarasota-Bradenton, FL
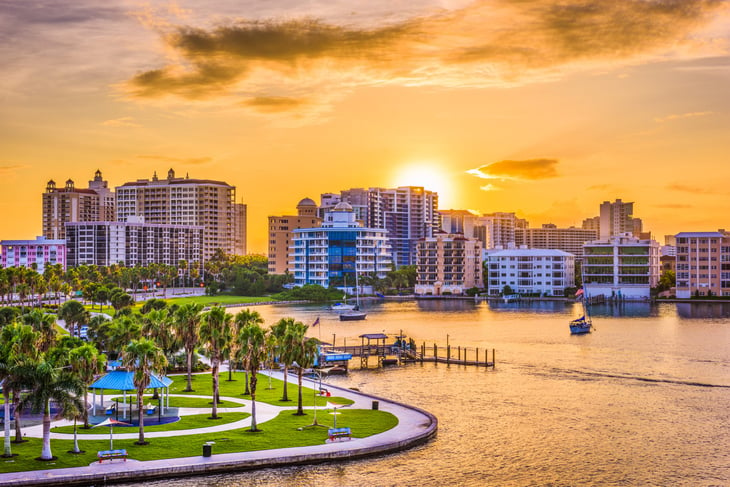
- Per capita annual sales at RV dealers: $129
- Annual sales at RV dealers: $108,316,000
- Density of RV dealers (compared to average): +99.7%
- Median household income: $65,526
- Population: 836,995
13. Orlando-Kissimmee-Sanford, FL

- Per capita annual sales at RV dealers: $144
- Annual sales at RV dealers: $374,513,000
- Density of RV dealers (compared to average): -35.9%
- Median household income: $61,876
- Population: 2,608,147
12. Sacramento–Roseville–Arden-Arcade, CA

- Per capita annual sales at RV dealers: $146
- Annual sales at RV dealers: $345,659,000
- Density of RV dealers (compared to average): +54.3%
- Median household income: $76,706
- Population: 2,363,730
11. Portland-Vancouver-Hillsboro, OR-WA

- Per capita annual sales at RV dealers: $152
- Annual sales at RV dealers: $379,560,000
- Density of RV dealers (compared to average): +52.4%
- Median household income: $78,439
- Population: 2,493,221
10. Oklahoma City, OK

- Per capita annual sales at RV dealers: $153
- Annual sales at RV dealers: $216,145,000
- Density of RV dealers (compared to average): +18.6%
- Median household income: $60,605
- Population: 1,408,950
9. Tulsa, OK

- Per capita annual sales at RV dealers: $154
- Annual sales at RV dealers: $154,280,000
- Density of RV dealers (compared to average): +67.4%
- Median household income: $57,859
- Population: 998,655
8. Jacksonville, FL

- Per capita annual sales at RV dealers: $160
- Annual sales at RV dealers: $249,257,000
- Density of RV dealers (compared to average): +7.2%
- Median household income: $65,880
- Population: 1,559,514
7. Knoxville, TN

- Per capita annual sales at RV dealers: $186
- Annual sales at RV dealers: $161,989,000
- Density of RV dealers (compared to average): +109.7%
- Median household income: $56,623
- Population: 869,525
6. Albuquerque, NM
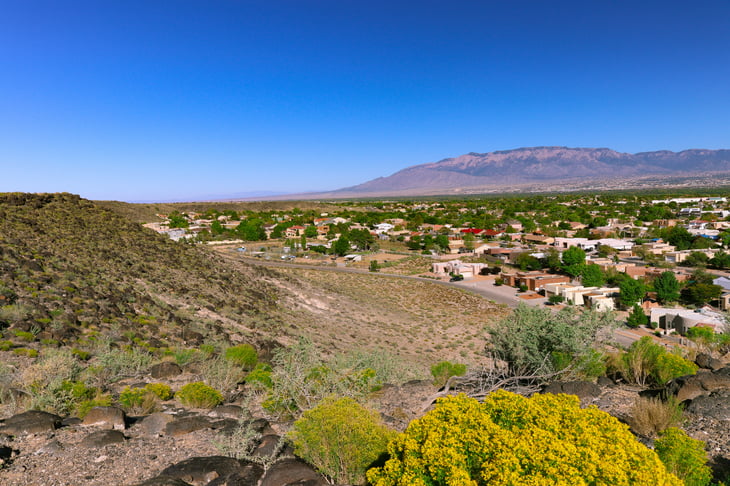
- Per capita annual sales at RV dealers: $199
- Annual sales at RV dealers: $181,655,000
- Density of RV dealers (compared to average): +116.0%
- Median household income: $58,512
- Population: 914,480
5. Tucson, AZ
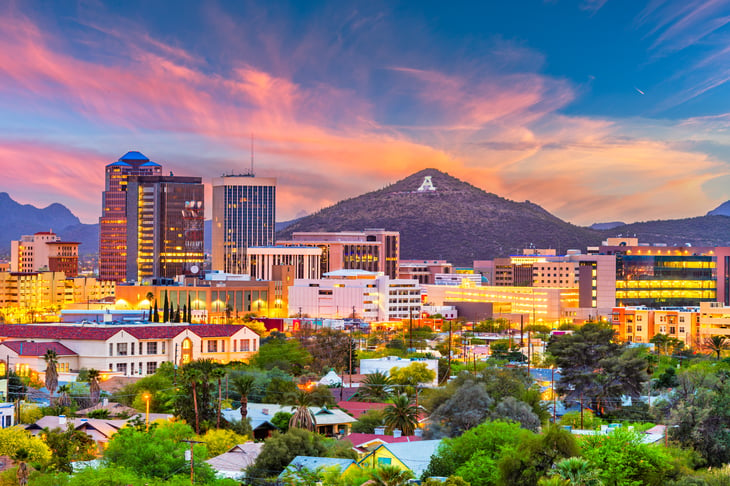
- Per capita annual sales at RV dealers: $210
- Annual sales at RV dealers: $220,123,000
- Density of RV dealers (compared to average): +88.6%
- Median household income: $56,169
- Population: 1,047,279
4. Salt Lake City, UT
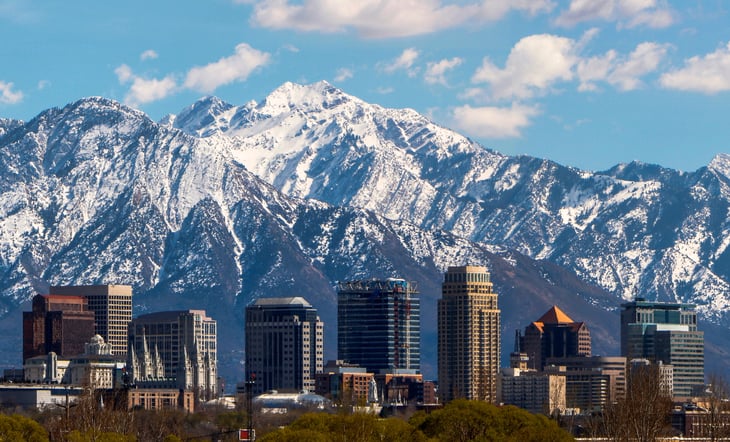
- Per capita annual sales at RV dealers: $215
- Annual sales at RV dealers: $264,572,000
- Density of RV dealers (compared to average): +35.6%
- Median household income: $80,196
- Population: 1,232,696
3. Grand Rapids-Wyoming, MI

- Per capita annual sales at RV dealers: $253
- Annual sales at RV dealers: $272,869,000
- Density of RV dealers (compared to average): +83.4%
- Median household income: $65,739
- Population: 1,077,370
2. Tampa-St. Petersburg-Clearwater, FL
- Per capita annual sales at RV dealers: $256
- Annual sales at RV dealers: $818,394,000
- Density of RV dealers (compared to average): -0.1%
- Median household income: $57,906
- Population: 3,194,831
1. Cape Coral-Fort Myers, FL
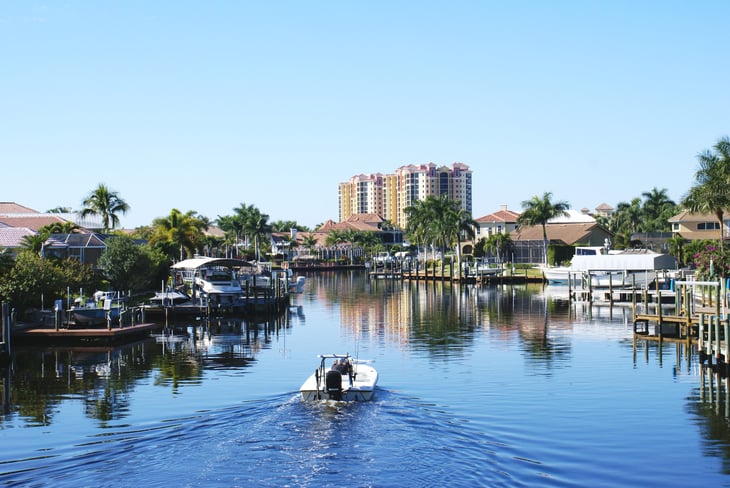
- Per capita annual sales at RV dealers: $377
- Annual sales at RV dealers: $290,554,000
- Density of RV dealers (compared to average): +116.9%
- Median household income: $62,240
- Population: 770,577
Detailed Findings & Methodology

The data used in this analysis is from the most recent U.S. Census Bureau Economic Census, released in 2020, as well as the RV Industry Association.
To determine the locations with the most RV spending per capita, researchers calculated annual sales at recreational vehicle dealers per person.
In the event of a tie, the location with the greater annual sales at RV dealers was ranked higher. To improve relevance, only metropolitan areas with at least 100,000 residents were included.
Add a Comment
Our Policy: We welcome relevant and respectful comments in order to foster healthy and informative discussions. All other comments may be removed. Comments with links are automatically held for moderation.