


Editor's Note: This story originally appeared on Filterbuy.
The U.S. job market has made great strides in its recovery since the early days of the COVID-19 pandemic. In April 2020, the unemployment rate skyrocketed to 14.7%, the highest it’s been since the Great Depression.
But since the spring of 2020, the unemployment rate has fallen steadily and currently stands below 4%, just slightly higher than the pre-pandemic rate of 3.5%. While all sectors of the economy were impacted by the pandemic and shutdowns in early 2020, some parts of the economy have bounced back more quickly than others.
For example, while the unemployment rate could reach pre-pandemic levels by this summer, the labor force participation rate continues to lag behind. In February 2020, the labor force participation rate was 63.4%. After dropping sharply in the early stages of the pandemic and then partially recovering, it is still nearly a full percentage point below the pre-pandemic level.
There are several reasons for reduced labor force participation. Many older workers decided to retire early during the pandemic and are unlikely to return. Nearly 1 million Americans, many of whom were part of the workforce, have died from COVID-19, and millions more are suffering from what has come to be known as long COVID and are unable to work. Additionally, school and daycare closures have forced many parents to leave their jobs due to caregiving responsibilities.
Besides reduced labor force participation, some industries, particularly ones that are highly reliant on face-to-face interactions, remained hindered in 2021.
To determine the U.S. metropolitan areas with the highest overall unemployment rates in 2021, researchers at Filterbuy analyzed data from the U.S. Bureau of Labor Statistics. The researchers ranked metros according to the average annual unemployment rate in 2021. You can read more about our methodology at the end.
Following are the metros with the highest unemployment rates in 2021.
15. Memphis, TN-MS-AR

Average annual unemployment rate in 2021: 5.9%
Average number of unemployed workers in 2021: 37,975
Change in unemployment rate since 2020 (percentage points): -2.9
Change in unemployment rate since 2019 (percentage points): +1.7
14. Cleveland-Elyria, OH
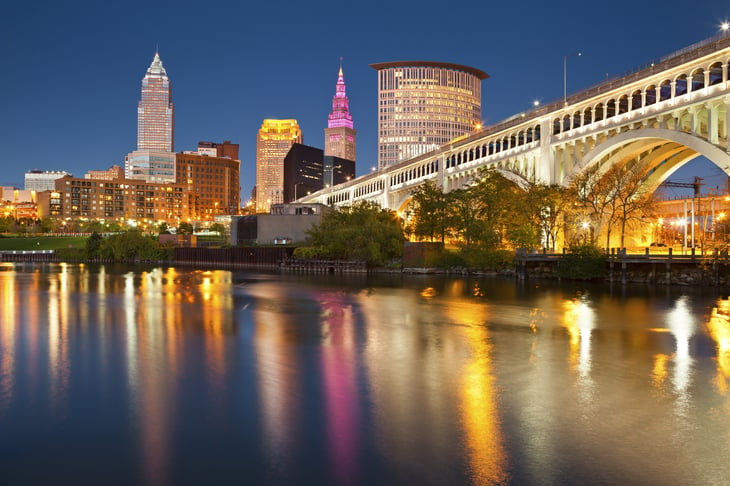
Average annual unemployment rate in 2021: 5.9%
Average number of unemployed workers in 2021: 59,744
Change in unemployment rate since 2020 (percentage points): -3.9
Change in unemployment rate since 2019 (percentage points): +1.7
13. Pittsburgh, PA
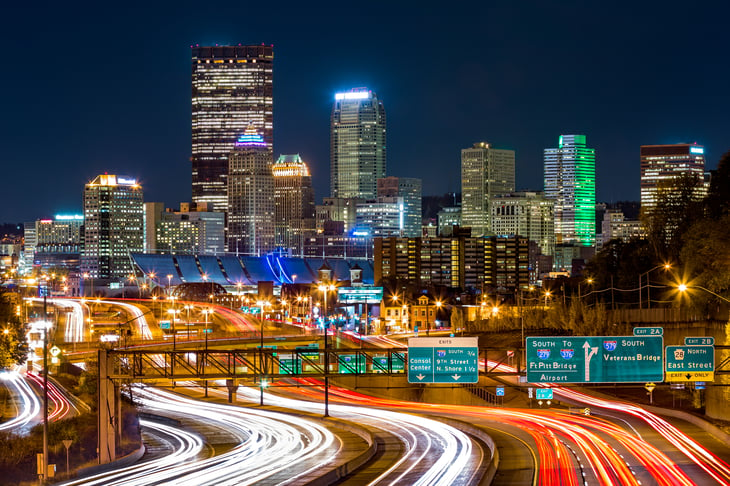
Average annual unemployment rate in 2021: 6.1%
Average number of unemployed workers in 2021: 71,379
Change in unemployment rate since 2020 (percentage points): -3.1
Change in unemployment rate since 2019 (percentage points): +1.7
12. Sacramento-Roseville-Folsom, CA

Average annual unemployment rate in 2021: 6.2%
Average number of unemployed workers in 2021: 67,659
Change in unemployment rate since 2020 (percentage points): -2.5
Change in unemployment rate since 2019 (percentage points): +2.5
11. Detroit-Warren-Dearborn, MI
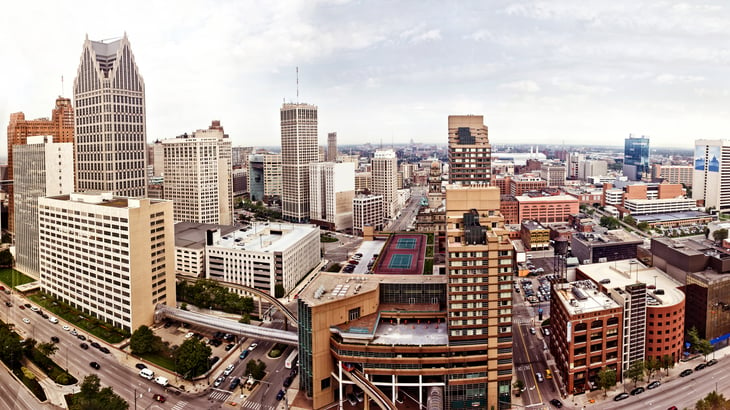
Average annual unemployment rate in 2021: 6.2%
Average number of unemployed workers in 2021: 131,597
Change in unemployment rate since 2020 (percentage points): -5.3
Change in unemployment rate since 2019 (percentage points): +2.0
10. San Diego-Chula Vista-Carlsbad, CA

Average annual unemployment rate in 2021: 6.3%
Average number of unemployed workers in 2021: 96,330
Change in unemployment rate since 2020 (percentage points): -2.9
Change in unemployment rate since 2019 (percentage points): +3.0
9. Philadelphia-Camden-Wilmington, PA-NJ-DE-MD

Average annual unemployment rate in 2021: 6.3%
Average number of unemployed workers in 2021: 192,279
Change in unemployment rate since 2020 (percentage points): -2.9
Change in unemployment rate since 2019 (percentage points): +2.2
8. Hartford-East Hartford-Middletown, CT

Average annual unemployment rate in 2021: 6.6%
Average number of unemployed workers in 2021: 38,793
Change in unemployment rate since 2020 (percentage points): -1.1
Change in unemployment rate since 2019 (percentage points): +3.0
7. Houston-The Woodlands-Sugar Land, TX

Average annual unemployment rate in 2021: 6.6%
Average number of unemployed workers in 2021: 226,911
Change in unemployment rate since 2020 (percentage points): -2.0
Change in unemployment rate since 2019 (percentage points): +2.8
6. Chicago-Naperville-Elgin, IL-IN-WI

Average annual unemployment rate in 2021: 6.8%
Average number of unemployed workers in 2021: 320,395
Change in unemployment rate since 2020 (percentage points): -3.1
Change in unemployment rate since 2019 (percentage points): +2.9
5. New Orleans-Metairie, LA

Average annual unemployment rate in 2021: 7.1%
Average number of unemployed workers in 2021: 41,476
Change in unemployment rate since 2020 (percentage points): -2.6
Change in unemployment rate since 2019 (percentage points): +2.8
4. Riverside-San Bernardino-Ontario, CA
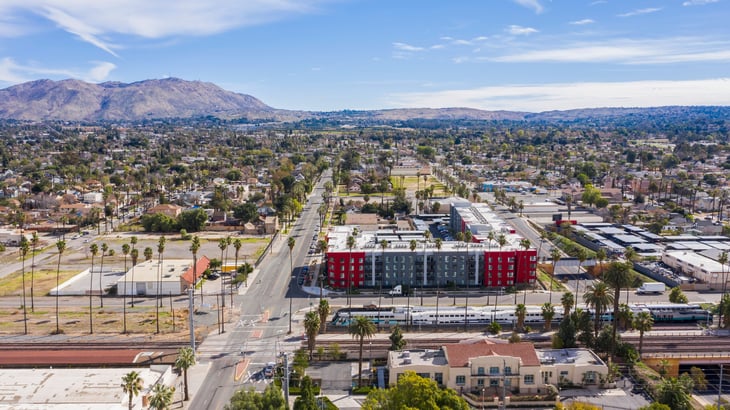
Average annual unemployment rate in 2021: 7.2%
Average number of unemployed workers in 2021: 150,179
Change in unemployment rate since 2020 (percentage points): -2.5
Change in unemployment rate since 2019 (percentage points): +3.1
3. New York-Newark-Jersey City, NY-NJ-PA

Average annual unemployment rate in 2021: 7.7%
Average number of unemployed workers in 2021: 745,984
Change in unemployment rate since 2020 (percentage points): -2.7
Change in unemployment rate since 2019 (percentage points): +4.1
2. Las Vegas-Henderson-Paradise, NV
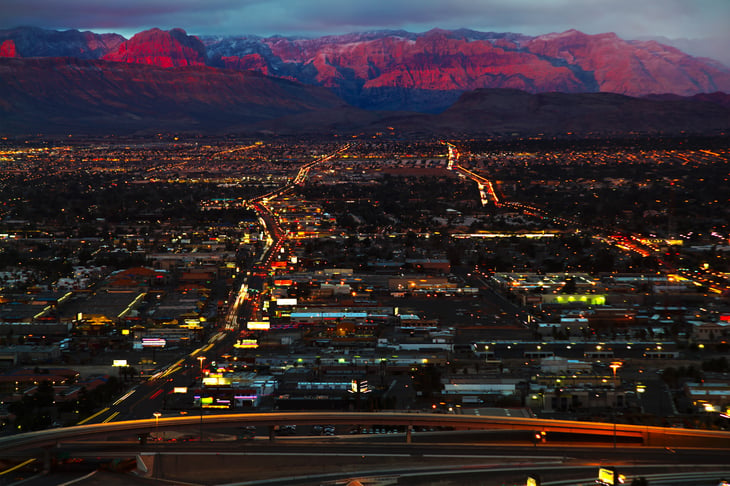
Average annual unemployment rate in 2021: 8.3%
Average number of unemployed workers in 2021: 92,877
Change in unemployment rate since 2020 (percentage points): -6.4
Change in unemployment rate since 2019 (percentage points): +4.2
1. Los Angeles-Long Beach-Anaheim, CA

Average annual unemployment rate in 2021: 8.7%
Average number of unemployed workers in 2021: 576,693
Change in unemployment rate since 2020 (percentage points): -3.1
Change in unemployment rate since 2019 (percentage points): +4.5
Methodology

To determine the locations with the highest overall unemployment rate in 2021, researchers at Filterbuy analyzed the data from the U.S. Bureau of Labor Statistics’s Local Area Unemployment Statistics. The researchers ranked locations according to the average annual unemployment rate in 2021. In the event of a tie, the location with the larger average number of unemployed workers in 2021 was ranked higher.
Researchers also calculated the change in unemployment rate since 2020, and the change in unemployment rate since 2019. To improve relevance, only metropolitan areas with at least 100,000 residents were included.
Add a Comment
Our Policy: We welcome relevant and respectful comments in order to foster healthy and informative discussions. All other comments may be removed. Comments with links are automatically held for moderation.