


Editor's Note: This story originally appeared on Porch.
Unusually high demand in the real estate market has been a consistent fact throughout the COVID-19 pandemic. While real estate sales — like most aspects of the economy — ground to a halt in March and April of 2020, buyers since then have been snapping homes up quickly, often offering to pay above asking prices and make other concessions to land a deal.
Part of the reason for this spike in demand has been favorable economic conditions for middle and upper-income earners. While lower-wage workers have been at much greater risk of economic instability during the pandemic, most professional class workers were able to keep their jobs by transitioning to remote work, save money from reduced spending in categories like travel, entertainment, and food, and enjoy strong returns in the stock market. Good household financial conditions and low mortgage interest rates put homeownership within reach of many buyers.
The total volume of home sales nationwide shows the extent of this demand. Seasonally-adjusted monthly home sales dropped sharply early at the start of the pandemic to less than 400,000 in May 2020 but rebounded to a peak of more than 650,000 in October 2020. Monthly sales since then have leveled out at a lower level, but still well above pre-pandemic levels. This volume of homes is moving off the market even in spite of the fact that the inventory of homes for sale was at record lows for most of the pandemic.
Large Metros With the Most Home Sales Per Capita
While demand is unusually high in most markets, some locations are seeing greater competition than others. Notably, Florida and Nevada are far ahead of other states in average monthly home sales at 19.7 and 16.9 home sales per 10,000 residents, respectively. Most of the leading states offer a combination of relatively affordable real estate, strong economic opportunities, and temperate climates that make them appealing alternatives to high-cost states like California and New York, which are seeing greater numbers of people moving away. At the metro level, the same trends hold with many so-called “second-tier cities” in the South and West experiencing the greatest demand.
The data used in this analysis is from Redfin and the U.S. Census Bureau. To determine the metropolitan areas with the most home sales, researchers at Porch calculated the average monthly home sales per 10,000 residents between January and September 2021. In the event of a tie, the location with the greater average monthly home sales was ranked higher. Researchers also included median days on the market, the percentage of homes that sold above asking, and median sale price. To improve relevance, only locations with at least 100,000 residents and available data from Redfin were included. Additionally, metros were grouped into cohorts based on population size.
Here are the large metros (population 1 million or more) with the most home sales per capita.
15. Minneapolis-St. Paul-Bloomington, MN-WI
- Average monthly home sales (per 10,000 residents): 15.3
- Average monthly home sales (total): 5,600
- Median days on market: 16
- Percentage of homes that sold above asking: 59.6%
- Median sale price: $340,585

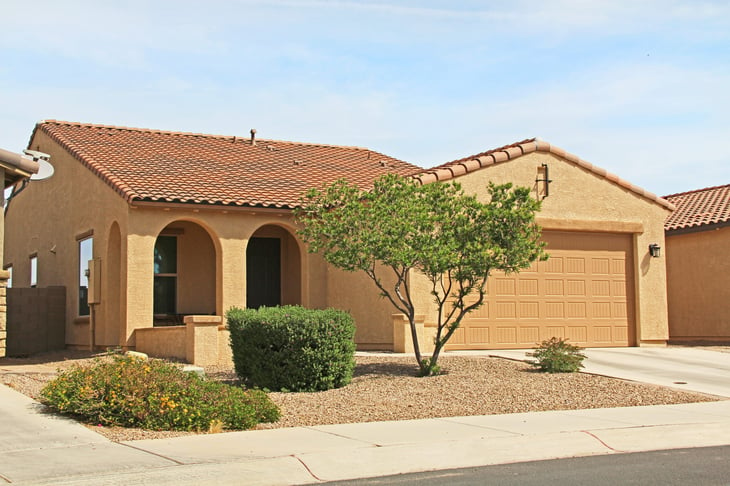
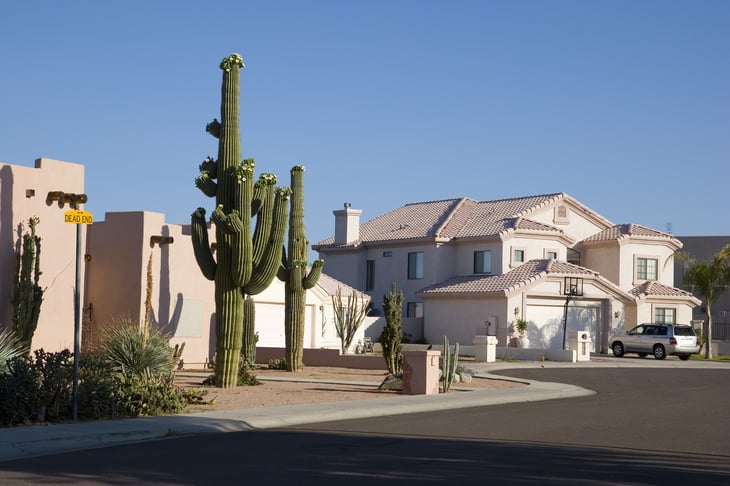
14. Tucson, AZ
- Average monthly home sales (per 10,000 residents): 15.6
- Average monthly home sales (total): 1,652
- Median days on market: 39
- Percentage of homes that sold above asking: 46.7%
- Median sale price: $296,913
13. Seattle-Tacoma-Bellevue, WA

- Average monthly home sales (per 10,000 residents): 15.9
- Average monthly home sales (total): 6,390
- Median days on market: 6
- Percentage of homes that sold above asking: 63.3%
- Median sale price: $660,383
12. Virginia Beach-Norfolk-Newport News, VA-NC

- Average monthly home sales (per 10,000 residents): 16.4
- Average monthly home sales (total): 2,927
- Median days on market: 21
- Percentage of homes that sold above asking: 52.6%
- Median sale price: $280,246
11. Atlanta-Sandy Springs-Alpharetta, GA

- Average monthly home sales (per 10,000 residents): 16.5
- Average monthly home sales (total): 10,071
- Median days on market: 14
- Percentage of homes that sold above asking: 48.0%
- Median sale price: $318,216
10. Charlotte-Concord-Gastonia, NC-SC
- Average monthly home sales (per 10,000 residents): 16.6
- Average monthly home sales (total): 4,445
- Median days on market: 34
- Percentage of homes that sold above asking: 52.6%
- Median sale price: $327,622
9. Denver-Aurora-Lakewood, CO

- Average monthly home sales (per 10,000 residents): 16.9
- Average monthly home sales (total): 5,052
- Median days on market: 6
- Percentage of homes that sold above asking: 65.0%
- Median sale price: $519,201
8. Phoenix-Mesa-Chandler, AZ
- Average monthly home sales (per 10,000 residents): 17.3
- Average monthly home sales (total): 8,777
- Median days on market: 26
- Percentage of homes that sold above asking: 51.9%
- Median sale price: $389,758
7. Raleigh-Cary, NC

- Average monthly home sales (per 10,000 residents): 17.6
- Average monthly home sales (total): 2,495
- Median days on market: 36
- Percentage of homes that sold above asking: 59.2%
- Median sale price: $355,787
6. Orlando-Kissimmee-Sanford, FL
- Average monthly home sales (per 10,000 residents): 17.8
- Average monthly home sales (total): 4,703
- Median days on market: 14
- Percentage of homes that sold above asking: 32.0%
- Median sale price: $317,623
5. Miami-Fort Lauderdale-Pompano Beach, FL
- Average monthly home sales (per 10,000 residents): 17.8
- Average monthly home sales (total): 10,982
- Median days on market: 56
- Percentage of homes that sold above asking: 20.7%
- Median sale price: $364,244
4. Las Vegas-Henderson-Paradise, NV

- Average monthly home sales (per 10,000 residents): 18.3
- Average monthly home sales (total): 4,230
- Median days on market: 24
- Percentage of homes that sold above asking: 44.2%
- Median sale price: $354,946
3. Nashville-Davidson–Murfreesboro–Franklin, TN

- Average monthly home sales (per 10,000 residents): 18.9
- Average monthly home sales (total): 3,710
- Median days on market: 25
- Percentage of homes that sold above asking: 44.2%
- Median sale price: $370,185

2. Tampa-St. Petersburg-Clearwater, FL

- Average monthly home sales (per 10,000 residents): 19.8
- Average monthly home sales (total): 6,432
- Median days on market: 11
- Percentage of homes that sold above asking: 36.8%
- Median sale price: $298,234
1. Jacksonville, FL
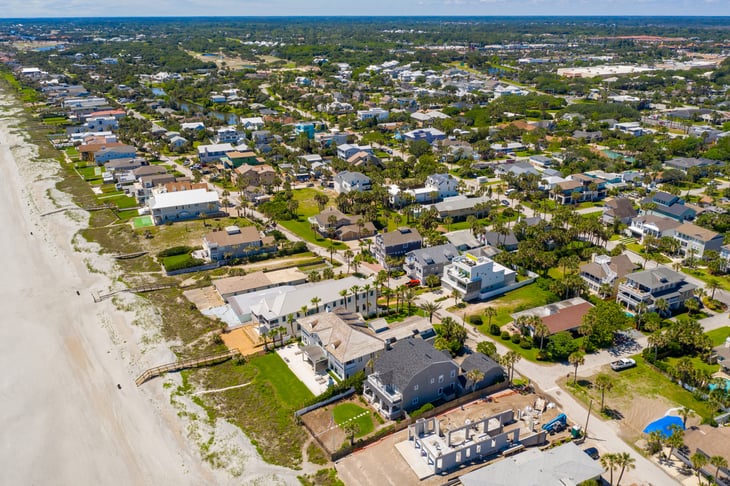
- Average monthly home sales (per 10,000 residents): 19.9
- Average monthly home sales (total): 3,158
- Median days on market: 28
- Percentage of homes that sold above asking: 35.4%
- Median sale price: $292,631
Detailed Findings & Methodology

The data used in this analysis is from Redfin’s Data Center and the U.S. Census Bureau’s 2020 Population Estimates. To determine the locations with the most home sales per capita, researchers calculated the average monthly home sales per 10,000 residents between January and September 2021. In the event of a tie, the location with the greater average monthly home sales was ranked higher. The additional fields of median days on market, percentage of homes that sold above asking, and median sale price were determined using a weighted average of the monthly data based on the number of homes sold for the specific location and time period. To improve relevance, only locations with at least 100,000 residents and available data from Redfin were included. Additionally, metros were grouped into cohorts based on population size: small (100,000–349,999), midsize (350,000–999,999), and large (1,000,000 or more).
Add a Comment
Our Policy: We welcome relevant and respectful comments in order to foster healthy and informative discussions. All other comments may be removed. Comments with links are automatically held for moderation.