


Editor's Note: This story originally appeared on CoPilot.
Amid recent concerns about inflation in the economy, the market for new and used vehicles is one of the sectors that has drawn the most attention.
With the global economy still facing ongoing supply chain challenges — particularly a shortage of semiconductor chips needed for computer systems in modern vehicles — fewer new cars are hitting the market, which has raised the demand for pre-owned vehicles. Additionally, rapidly rising gas prices in recent weeks have boosted demand for more fuel-efficient vehicles.
The result has been higher prices for both new and used cars. According to recent data from the Bureau of Labor Statistics, the prices for new vehicles rose 12.4% from February 2021 to February 2022, while used cars and trucks saw price increases of 41.2% last year — one of the largest increases of any category in the Consumer Price Index.
The recent spike in vehicle prices stands out in part because the price for cars has otherwise shown a slow rate of growth in recent years. From 1997 to 2020, per capita annual spending on vehicle purchases rose from $930 to $1,399, which averages out to a 1.8% annualized increase — a figure in line with normal levels of inflation.
To identify the states where people are spending the most on cars, researchers at CoPilot calculated total motor vehicle spending per capita in 2020, which includes both new and used vehicle purchases as well as vehicle operation expenses. Vehicle operation includes spending on fuels, lubricants, and fluids; maintenance and repairs; parts and accessories; and other motor vehicle services. The data used in this analysis is from the U.S. Bureau of Economic Analysis 2020 Personal Consumption Expenditures.
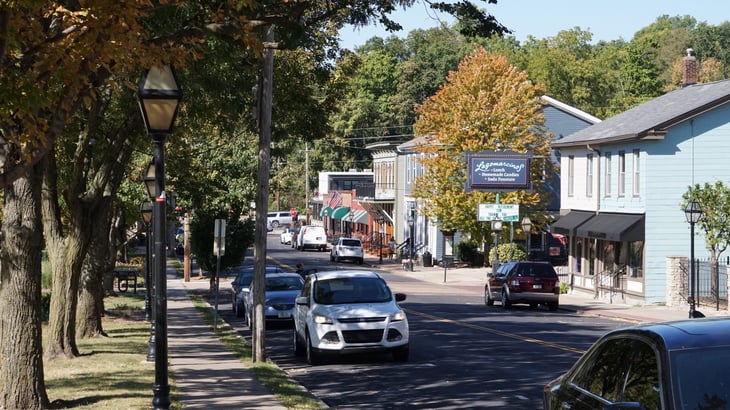
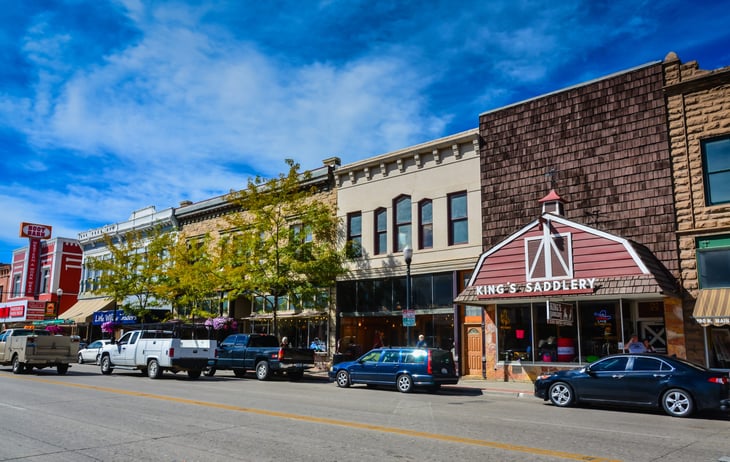
Here are the states where residents spend the most on motor vehicles.
15. Alaska
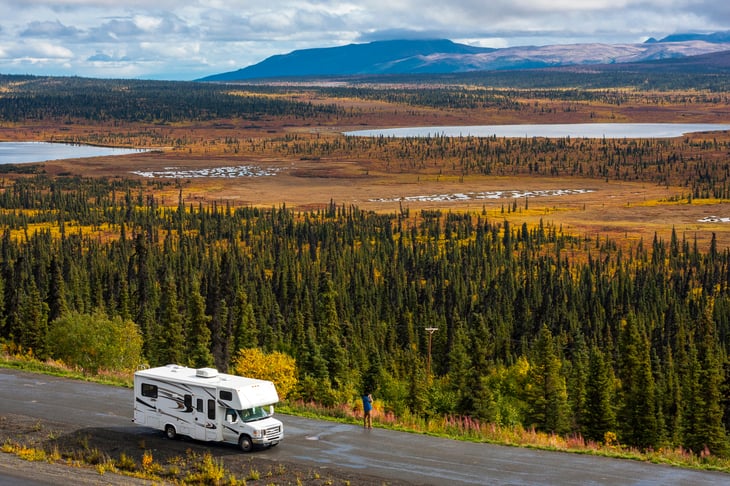
- Total motor vehicle spending per capita: $3,563
- New & used motor vehicle purchases: $1,467
- Motor vehicle fuels, lubricants & fluids: $507
- Motor vehicle maintenance & repair: $661
- Motor vehicle parts & accessories: $389
- Other motor vehicle services: $539
14. North Dakota

- Total motor vehicle spending per capita: $3,572
- New & used motor vehicle purchases: $1,765
- Motor vehicle fuels, lubricants & fluids: $613
- Motor vehicle maintenance & repair: $679
- Motor vehicle parts & accessories: $290
- Other motor vehicle services: $227

13. Texas

- Total motor vehicle spending per capita: $3,615
- New & used motor vehicle purchases: $1,740
- Motor vehicle fuels, lubricants & fluids: $781
- Motor vehicle maintenance & repair: $552
- Motor vehicle parts & accessories: $227
- Other motor vehicle services: $315
12. Utah
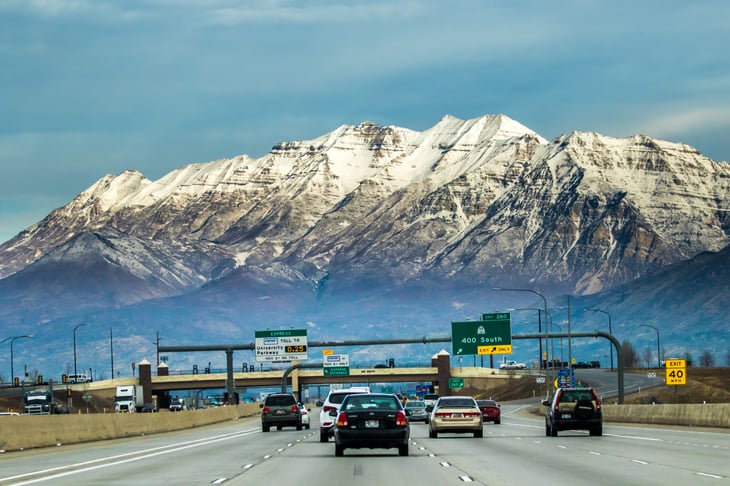
- Total motor vehicle spending per capita: $3,627
- New & used motor vehicle purchases: $1,698
- Motor vehicle fuels, lubricants & fluids: $762
- Motor vehicle maintenance & repair: $611
- Motor vehicle parts & accessories: $321
- Other motor vehicle services: $235
11. Vermont

- Total motor vehicle spending per capita: $3,632
- New & used motor vehicle purchases: $1,755
- Motor vehicle fuels, lubricants & fluids: $784
- Motor vehicle maintenance & repair: $668
- Motor vehicle parts & accessories: $290
- Other motor vehicle services: $135
10. Oklahoma

- Total motor vehicle spending per capita: $3,654
- New & used motor vehicle purchases: $1,823
- Motor vehicle fuels, lubricants & fluids: $924
- Motor vehicle maintenance & repair: $408
- Motor vehicle parts & accessories: $244
- Other motor vehicle services: $254
9. Minnesota

- Total motor vehicle spending per capita: $3,675
- New & used motor vehicle purchases: $1,687
- Motor vehicle fuels, lubricants & fluids: $811
- Motor vehicle maintenance & repair: $655
- Motor vehicle parts & accessories: $312
- Other motor vehicle services: $210
8. Colorado

- Total motor vehicle spending per capita: $3,700
- New & used motor vehicle purchases: $1,370
- Motor vehicle fuels, lubricants & fluids: $714
- Motor vehicle maintenance & repair: $826
- Motor vehicle parts & accessories: $404
- Other motor vehicle services: $386
7. Missouri
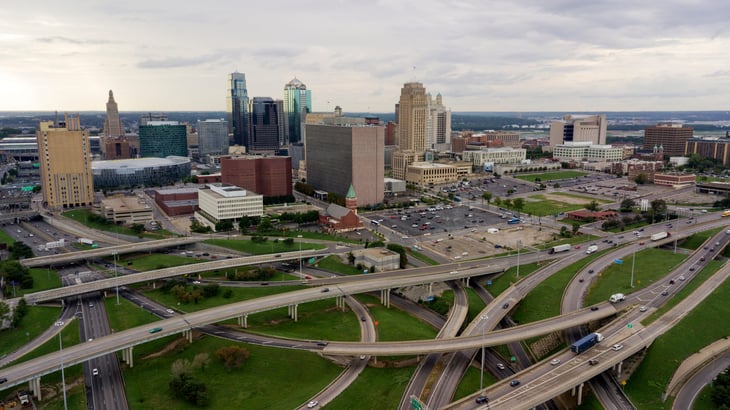
- Total motor vehicle spending per capita: $3,779
- New & used motor vehicle purchases: $1,610
- Motor vehicle fuels, lubricants & fluids: $982
- Motor vehicle maintenance & repair: $625
- Motor vehicle parts & accessories: $262
- Other motor vehicle services: $300
6. Maine
- Total motor vehicle spending per capita: $3,805
- New & used motor vehicle purchases: $1,690
- Motor vehicle fuels, lubricants & fluids: $988
- Motor vehicle maintenance & repair: $623
- Motor vehicle parts & accessories: $282
- Other motor vehicle services: $223
5. Iowa
- Total motor vehicle spending per capita: $4,015
- New & used motor vehicle purchases: $1,946
- Motor vehicle fuels, lubricants & fluids: $1,028
- Motor vehicle maintenance & repair: $613
- Motor vehicle parts & accessories: $290
- Other motor vehicle services: $138
4. Wyoming
- Total motor vehicle spending per capita: $4,068
- New & used motor vehicle purchases: $1,837
- Motor vehicle fuels, lubricants & fluids: $846
- Motor vehicle maintenance & repair: $695
- Motor vehicle parts & accessories: $448
- Other motor vehicle services: $241
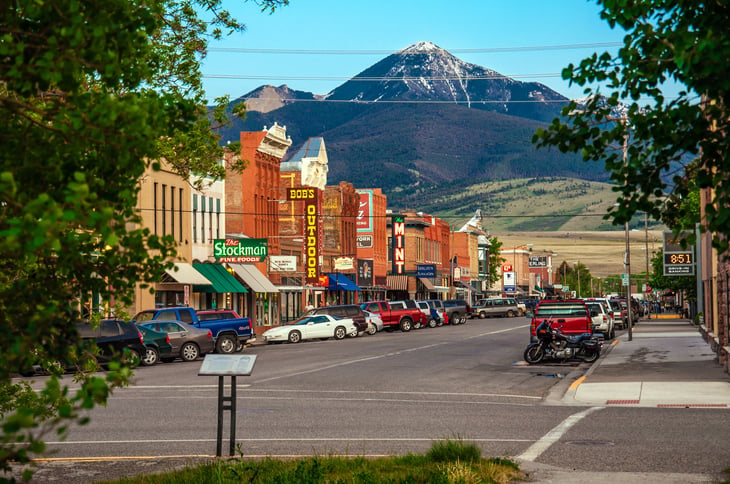
3. Montana
- Total motor vehicle spending per capita: $4,073
- New & used motor vehicle purchases: $1,920
- Motor vehicle fuels, lubricants & fluids: $829
- Motor vehicle maintenance & repair: $722
- Motor vehicle parts & accessories: $372
- Other motor vehicle services: $230
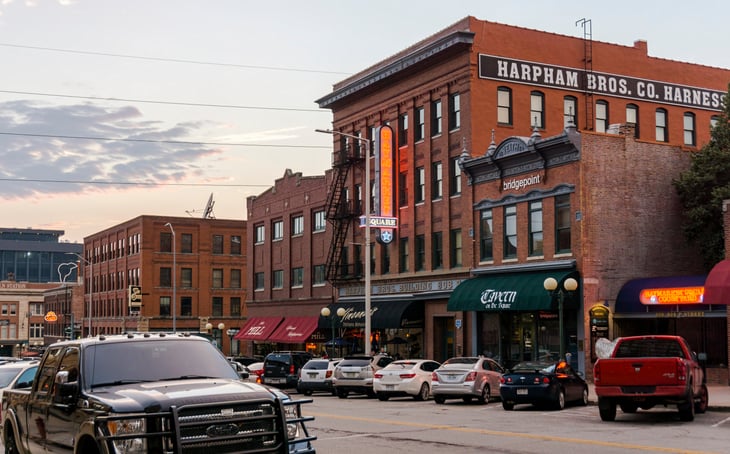
2. Nebraska
- Total motor vehicle spending per capita: $4,193
- New & used motor vehicle purchases: $2,028
- Motor vehicle fuels, lubricants & fluids: $1,039
- Motor vehicle maintenance & repair: $683
- Motor vehicle parts & accessories: $268
- Other motor vehicle services: $175
1. New Hampshire
- Total motor vehicle spending per capita: $4,195
- New & used motor vehicle purchases: $1,999
- Motor vehicle fuels, lubricants & fluids: $828
- Motor vehicle maintenance & repair: $812
- Motor vehicle parts & accessories: $239
- Other motor vehicle services: $317
Methodology

The data used in this analysis is from the U.S. Bureau of Economic Analysis 2020 Personal Consumption Expenditures.
To identify the states spending the most on cars, researchers calculated total motor vehicle spending per capita in 2020, which includes both new and used vehicle purchases as well as vehicle operation spending. Vehicle operation spending includes spending on fuels, lubricants, and fluids; maintenance and repairs; parts and accessories; and other motor vehicle services.
Add a Comment
Our Policy: We welcome relevant and respectful comments in order to foster healthy and informative discussions. All other comments may be removed. Comments with links are automatically held for moderation.