


Editor's Note: This story originally appeared on Upgraded Points.
Over the past four years, home affordability in the U.S. has rapidly deteriorated. A combination of home price growth, increases in mortgage rates, and income gains that have failed to keep pace has made it significantly harder for Americans to enter the housing market.
What was once a challenge in many markets has become largely an impossibility (without some form of assistance) as borrowing power has declined and home prices continue to grow.
Our analysis examines how long the typical household would need to save for a home in large U.S. cities, based on current home prices, mortgage rates, incomes, and other housing-related costs.
Buyers are assumed to earn the median income in their area, spend no more than 30% of it on housing, and purchase a median-priced home.
The down payment is calculated as the gap between the median home price and the maximum loan they can afford at today’s rates. To save that amount, they are assumed to invest 10% of their income, earning a 5% annual return.
The results reflect the growing disconnect between what homes cost and what households can realistically afford in the current market. Here are the major U.S. cities where saving for a home takes the longest.
20. Aurora, CO
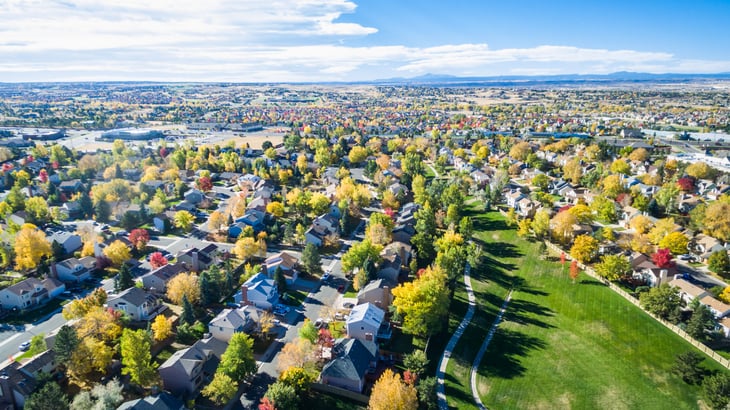
- Years to Save for Down Payment: 17.4
- Down Payment Necessary: $247,583
- Down Payment Percent: 50.7%
- Median Home Price: $488,471
- Max Loan Amount: $240,888
- Median Household Income: $89,443
- Max Monthly Housing Cost: $2,236
- Max Monthly Mortgage Payment: $1,575
- Non-Mortgage Housing Costs: $661
19. Washington, D.C.
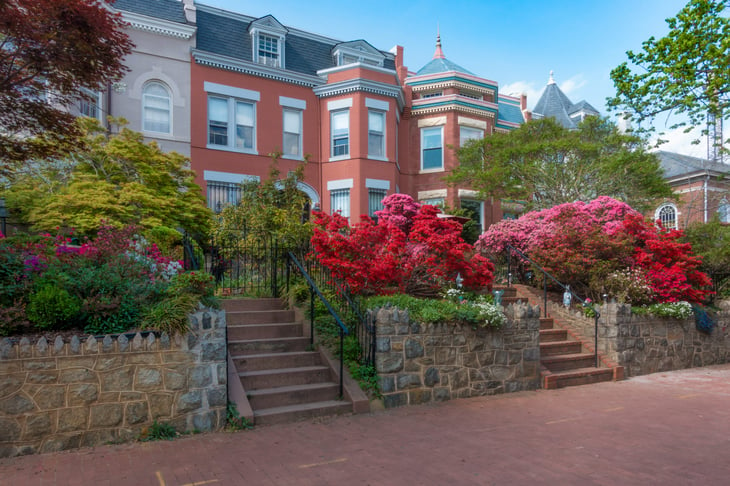
- Years to Save for Down Payment: 17.5
- Down Payment Necessary: $315,701
- Down Payment Percent: 51.9%
- Median Home Price: $607,877
- Max Loan Amount: $292,176
- Median Household Income: $112,745
- Max Monthly Housing Cost: $2,819
- Max Monthly Mortgage Payment: $1,911
- Non-Mortgage Housing Costs: $908
18. Nashville-Davidson, TN

- Years to Save for Down Payment: 17.8
- Down Payment Necessary: $228,284
- Down Payment Percent: 52.3%
- Median Home Price: $436,392
- Max Loan Amount: $208,109
- Median Household Income: $79,766
- Max Monthly Housing Cost: $1,994
- Max Monthly Mortgage Payment: $1,361
- Non-Mortgage Housing Costs: $633

17. Sacramento, CA

- Years to Save for Down Payment: 17.9
- Down Payment Necessary: $256,281
- Down Payment Percent: 52.6%
- Median Home Price: $487,408
- Max Loan Amount: $231,127
- Median Household Income: $88,842
- Max Monthly Housing Cost: $2,221
- Max Monthly Mortgage Payment: $1,511
- Non-Mortgage Housing Costs: $710
16. Fresno, CA

- Years to Save for Down Payment: 18.5
- Down Payment Necessary: $215,478
- Down Payment Percent: 55.6%
- Median Home Price: $387,604
- Max Loan Amount: $172,125
- Median Household Income: $70,863
- Max Monthly Housing Cost: $1,772
- Max Monthly Mortgage Payment: $1,126
- Non-Mortgage Housing Costs: $646

15. Denver, CO

- Years to Save for Down Payment: 18.5
- Down Payment Necessary: $296,079
- Down Payment Percent: 52.7%
- Median Home Price: $561,628
- Max Loan Amount: $265,549
- Median Household Income: $97,251
- Max Monthly Housing Cost: $2,431
- Max Monthly Mortgage Payment: $1,736
- Non-Mortgage Housing Costs: $695
14. Las Vegas, NV
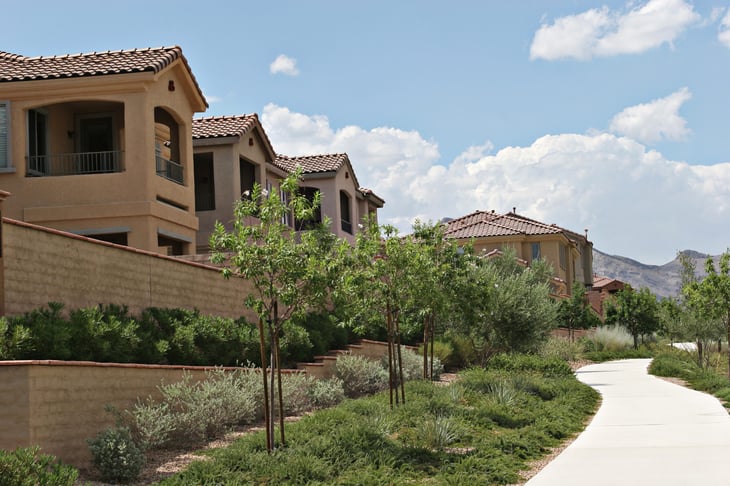
- Years to Save for Down Payment: 18.7
- Down Payment Necessary: $230,908
- Down Payment Percent: 53.5%
- Median Home Price: $431,579
- Max Loan Amount: $200,671
- Median Household Income: $75,020
- Max Monthly Housing Cost: $1,876
- Max Monthly Mortgage Payment: $1,312
- Non-Mortgage Housing Costs: $563

13. Tucson, AZ
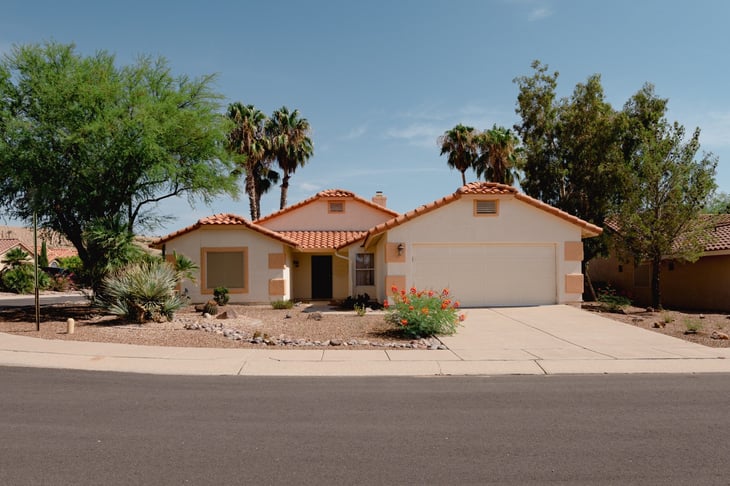
- Years to Save for Down Payment: 19.5
- Down Payment Necessary: $189,928
- Down Payment Percent: 57.5%
- Median Home Price: $330,025
- Max Loan Amount: $140,096
- Median Household Income: $57,860
- Max Monthly Housing Cost: $1,447
- Max Monthly Mortgage Payment: $916
- Non-Mortgage Housing Costs: $530
12. Austin, TX
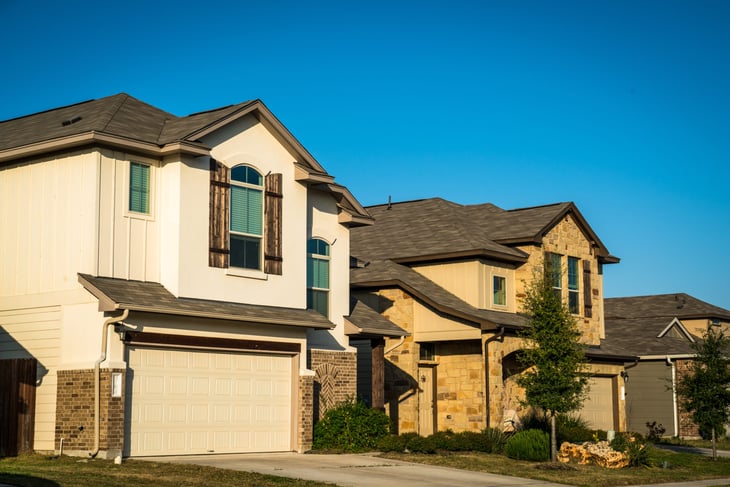
- Years to Save for Down Payment: 19.6
- Down Payment Necessary: $320,833
- Down Payment Percent: 60.9%
- Median Home Price: $526,444
- Max Loan Amount: $205,611
- Median Household Income: $97,018
- Max Monthly Housing Cost: $2,425
- Max Monthly Mortgage Payment: $1,345
- Non-Mortgage Housing Costs: $1,081

11. Portland, OR
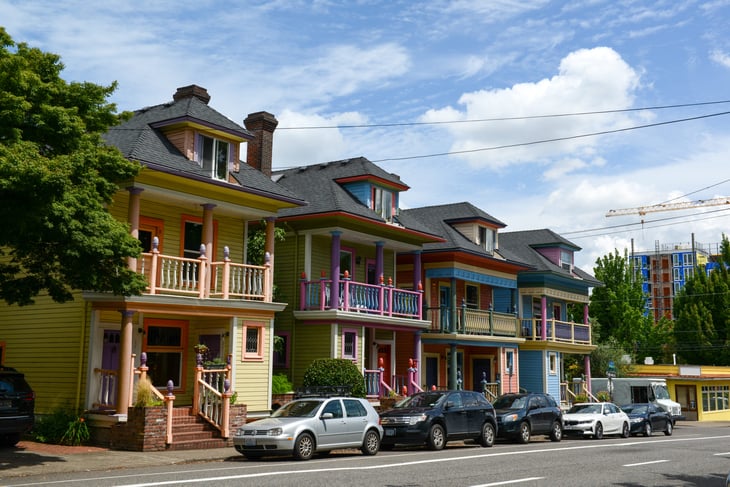
- Years to Save for Down Payment: 20.1
- Down Payment Necessary: $324,817
- Down Payment Percent: 60.0%
- Median Home Price: $541,664
- Max Loan Amount: $216,848
- Median Household Income: $94,187
- Max Monthly Housing Cost: $2,355
- Max Monthly Mortgage Payment: $1,418
- Non-Mortgage Housing Costs: $937
10. Seattle, WA
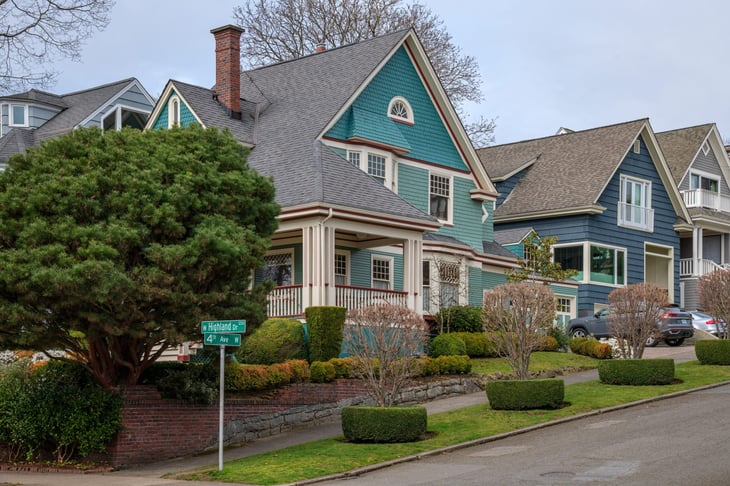
- Years to Save for Down Payment: 23.5
- Down Payment Necessary: $576,430
- Down Payment Percent: 64.8%
- Median Home Price: $888,951
- Max Loan Amount: $312,522
- Median Household Income: $129,396
- Max Monthly Housing Cost: $3,235
- Max Monthly Mortgage Payment: $2,044
- Non-Mortgage Housing Costs: $1,191

9. Oakland, CA
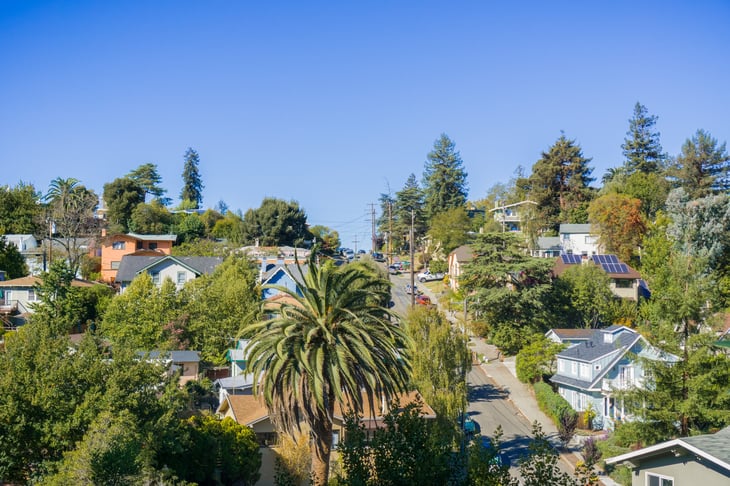
- Years to Save for Down Payment: 25.2
- Down Payment Necessary: $520,521
- Down Payment Percent: 68.8%
- Median Home Price: $756,579
- Max Loan Amount: $236,058
- Median Household Income: $103,285
- Max Monthly Housing Cost: $2,582
- Max Monthly Mortgage Payment: $1,544
- Non-Mortgage Housing Costs: $1,038
8. Boston, MA

- Years to Save for Down Payment: 26.1
- Down Payment Necessary: $537,400
- Down Payment Percent: 70.9%
- Median Home Price: $757,504
- Max Loan Amount: $220,104
- Median Household Income: $100,512
- Max Monthly Housing Cost: $2,513
- Max Monthly Mortgage Payment: $1,439
- Non-Mortgage Housing Costs: $1,073

7. San Francisco, CA

- Years to Save for Down Payment: 27.5
- Down Payment Necessary: $882,233
- Down Payment Percent: 67.7%
- Median Home Price: $1,302,230
- Max Loan Amount: $419,997
- Median Household Income: $150,040
- Max Monthly Housing Cost: $3,751
- Max Monthly Mortgage Payment: $2,746
- Non-Mortgage Housing Costs: $1,005
6. San Diego, CA
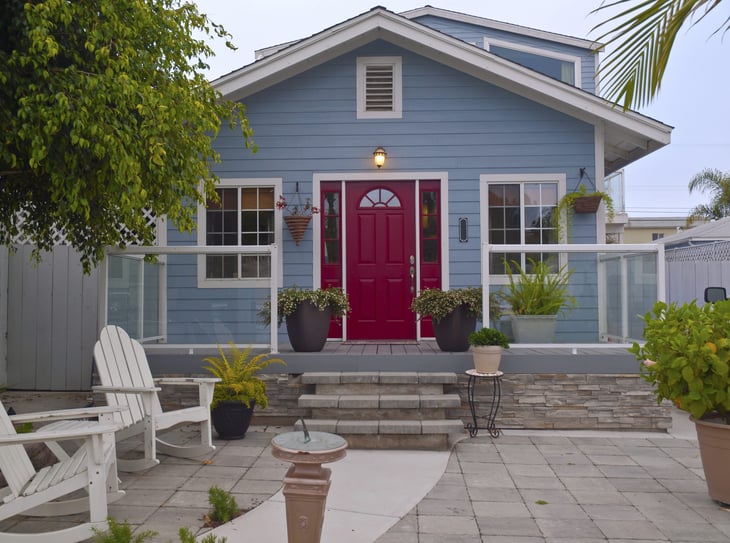
- Years to Save for Down Payment: 29.4
- Down Payment Necessary: $736,318
- Down Payment Percent: 71.6%
- Median Home Price: $1,028,632
- Max Loan Amount: $292,314
- Median Household Income: $110,659
- Max Monthly Housing Cost: $2,766
- Max Monthly Mortgage Payment: $1,912
- Non-Mortgage Housing Costs: $855

5. Long Beach, CA
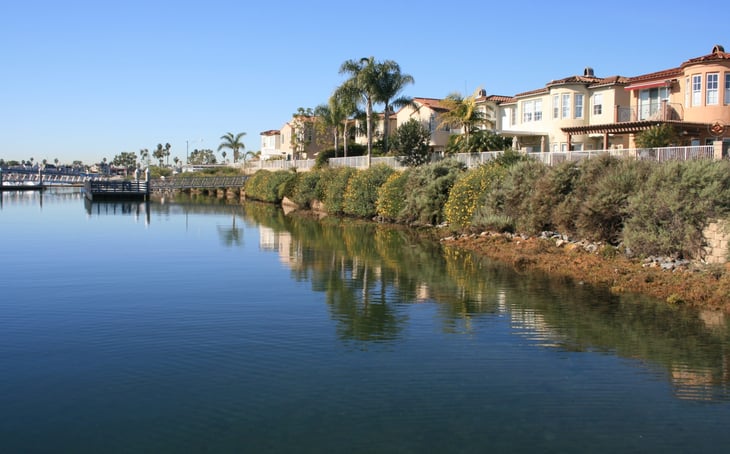
- Years to Save for Down Payment: 30.3
- Down Payment Necessary: $629,753
- Down Payment Percent: 73.2%
- Median Home Price: $860,458
- Max Loan Amount: $230,705
- Median Household Income: $89,071
- Max Monthly Housing Cost: $2,227
- Max Monthly Mortgage Payment: $1,509
- Non-Mortgage Housing Costs: $718
4. New York, NY

- Years to Save for Down Payment: 31.0
- Down Payment Necessary: $624,228
- Down Payment Percent: 81.3%
- Median Home Price: $767,759
- Max Loan Amount: $143,531
- Median Household Income: $84,556
- Max Monthly Housing Cost: $2,114
- Max Monthly Mortgage Payment: $939
- Non-Mortgage Housing Costs: $1,175

3. San Jose, CA
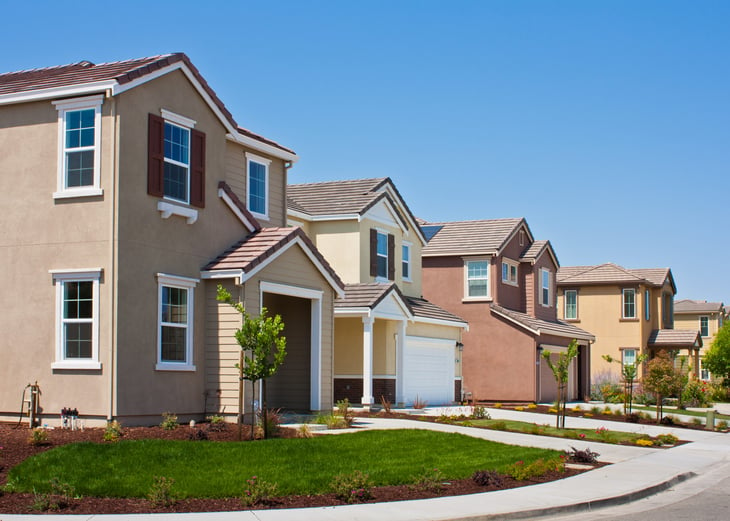
- Years to Save for Down Payment: 31.2
- Down Payment Necessary: $1,123,731
- Down Payment Percent: 73.4%
- Median Home Price: $1,531,233
- Max Loan Amount: $407,502
- Median Household Income: $150,166
- Max Monthly Housing Cost: $3,754
- Max Monthly Mortgage Payment: $2,665
- Non-Mortgage Housing Costs: $1,089
2. Miami, FL
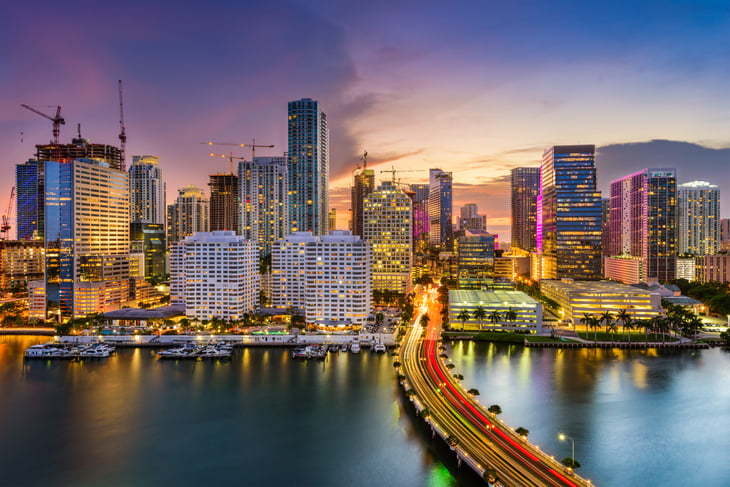
- Years to Save for Down Payment: 31.6
- Down Payment Necessary: $483,530
- Down Payment Percent: 81.7%
- Median Home Price: $591,524
- Max Loan Amount: $107,994
- Median Household Income: $62,998
- Max Monthly Housing Cost: $1,575
- Max Monthly Mortgage Payment: $706
- Non-Mortgage Housing Costs: $869

1. Los Angeles, CA
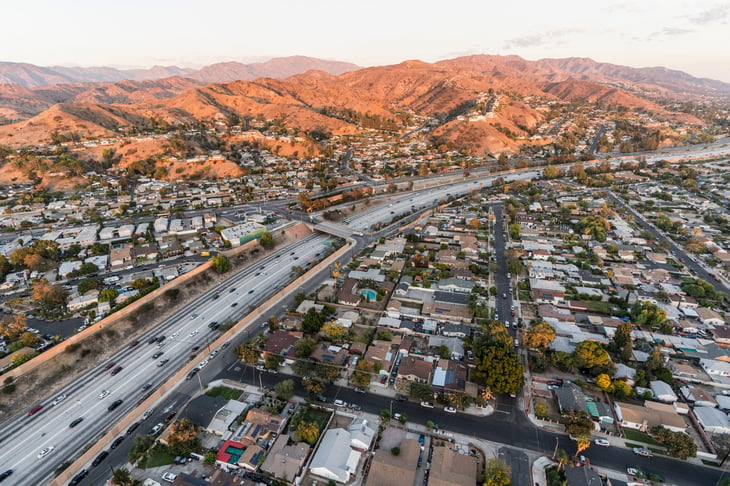
- Years to Save for Down Payment: 35.1
- Down Payment Necessary: $814,336
- Down Payment Percent: 82.6%
- Median Home Price: $986,145
- Max Loan Amount: $171,809
- Median Household Income: $85,249
- Max Monthly Housing Cost: $2,131
- Max Monthly Mortgage Payment: $1,124
- Non-Mortgage Housing Costs: $1,008
Methodology

The data used in this analysis comes from a combination of sources: the Zillow Home Value Index (ZHVI), the U.S. Census Bureau’s 2023 American Community Survey (ACS), Freddie Mac’s Primary Mortgage Market Survey, and the U.S. Bureau of Labor Statistics Consumer Price Index.
Home price and mortgage rate data are from the first quarter of 2025, while income and housing cost data come from the 2023 ACS — the most recent available — and have been inflation-adjusted to 2025 dollars.
To determine how long it would take a typical household to save for a home in each location, the following assumptions were made:
- Buyers are assumed to earn the median household income for their area. They allocate no more than 30% of their gross income to total housing costs, which include mortgage payments, insurance, property taxes, utilities, and homeowner association (HOA) fees where applicable.
- Buyers are assumed to purchase a median-priced home in their area. The required down payment is calculated as the greater of 20% of the home price or the difference between the home price and the maximum mortgage loan amount the buyer can afford, based on the 30% income constraint and a mortgage rate of 6.83%.
- To save for the down payment, buyers save 10% of their gross income. Savings are assumed to grow at a 5% annual rate of return.
Only cities and states with complete data from all sources were included in the final analysis. Locations with a margin of error greater than 10% on any estimate were excluded.


Add a Comment