



Editor's Note: This story originally appeared on Addiction-Rep.
Over the past decade, rates of mental illness, drug overdoses, and suicides have risen sharply across the United States, signaling a growing crisis in behavioral health.
According to the Centers for Disease Control and Prevention (CDC), the prevalence of depression and anxiety disorders has increased significantly, with young adults and historically underserved communities experiencing some of the steepest rises.
At the same time, the country has witnessed record-breaking numbers of drug overdose deaths, largely driven by opioids and synthetic substances like fentanyl. Suicide rates have also climbed, particularly among adolescents, veterans, and rural populations, underscoring the urgent need for accessible mental health care.
Despite this growing demand, many communities face a severe shortage of mental health professionals such as psychologists, counselors, therapists, social workers, and psychiatrists, among others.
To assess where these shortages are most acute, Addiction-Rep—a consulting firm for rehab and addiction treatment centers—analyzed data from multiple federal sources, measuring the number of mental health professionals per 10,000 residents in the nation’s largest metropolitan areas.
Here are the top major metro areas with the largest shortage of mental health workers.
20. Wichita, KS

- Mental health workers per 10,000 population: 44.3
- Mental health employment share: 0.95%
- Total mental health workers: 2,880
- Prevalence of depression: 19.7%
- Prevalence of frequent mental distress: 16.2%
19. San Antonio-New Braunfels, TX
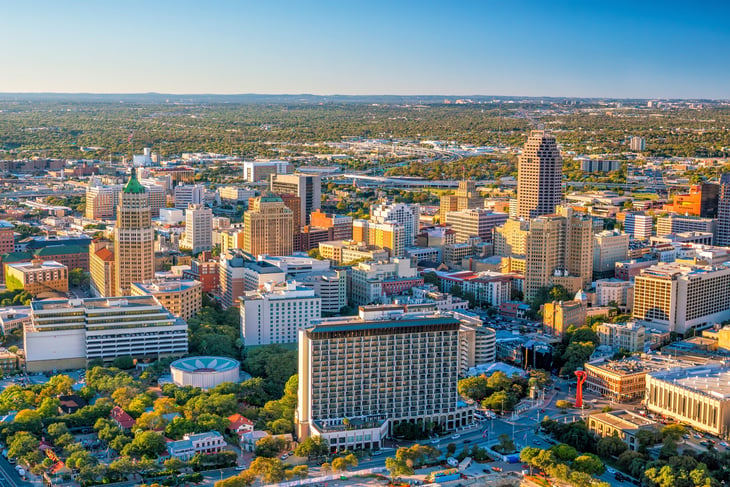
- Mental health workers per 10,000 population: 43.5
- Mental health employment share: 1.06%
- Total mental health workers: 11,550
- Prevalence of depression: 24.0%
- Prevalence of frequent mental distress: 17.6%
18. Orlando-Kissimmee-Sanford, FL
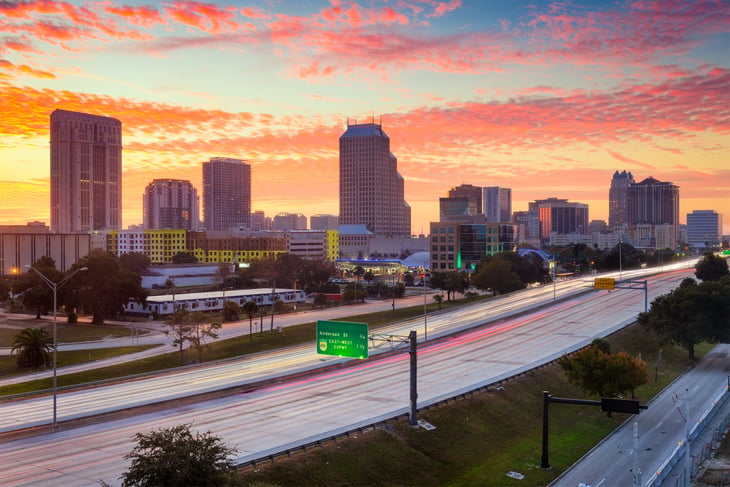
- Mental health workers per 10,000 population: 43.2
- Mental health employment share: 0.87%
- Total mental health workers: 11,950
- Prevalence of depression: 20.1%
- Prevalence of frequent mental distress: 17.0%

17. Ogden-Clearfield, UT

- Mental health workers per 10,000 population: 42.9
- Mental health employment share: 1.07%
- Total mental health workers: 3,070
- Prevalence of depression: 27.6%
- Prevalence of frequent mental distress: 16.6%
16. Charleston-North Charleston, SC
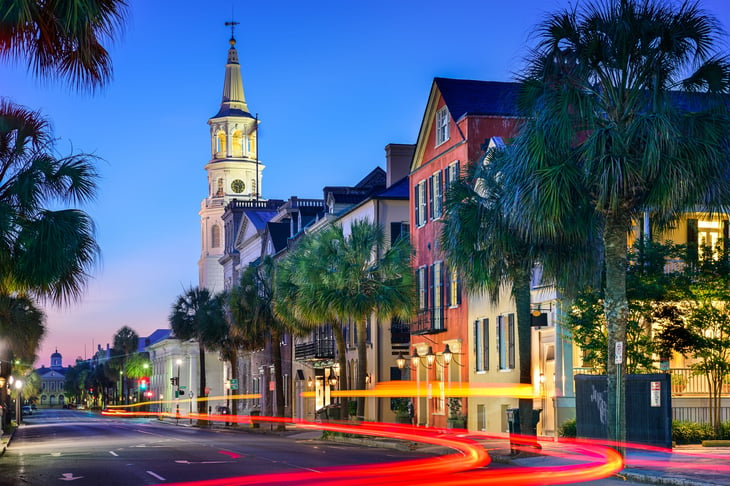
- Mental health workers per 10,000 population: 42.3
- Mental health employment share: 0.94%
- Total mental health workers: 3,510
- Prevalence of depression: 20.2%
- Prevalence of frequent mental distress: 14.7%

15. Las Vegas-Henderson-Paradise, NV
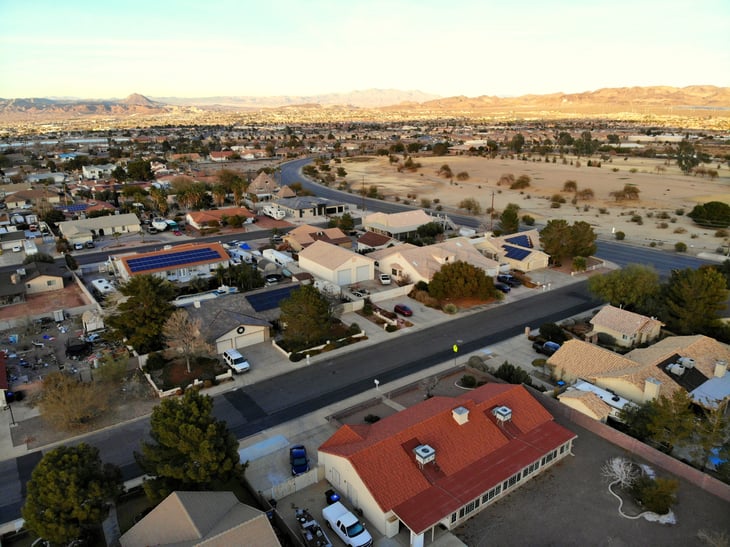
- Mental health workers per 10,000 population: 38.8
- Mental health employment share: 0.83%
- Total mental health workers: 9,010
- Prevalence of depression: 19.6%
- Prevalence of frequent mental distress: 16.3%
14. New Orleans-Metairie, LA
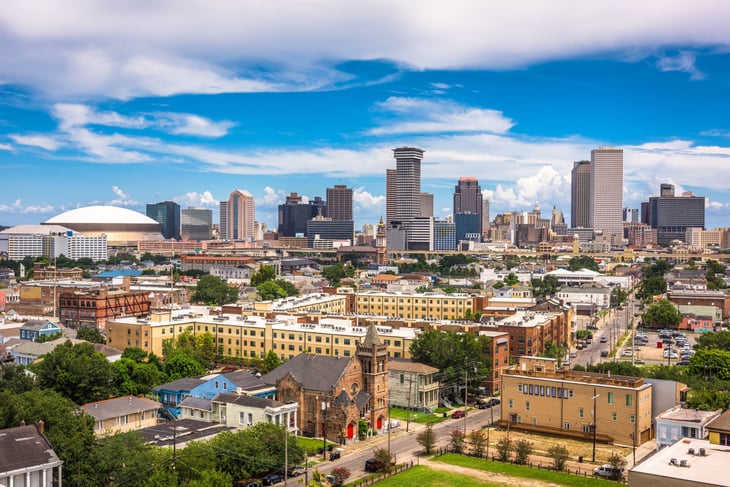
- Mental health workers per 10,000 population: 38.7
- Mental health employment share: 0.94%
- Total mental health workers: 4,820
- Prevalence of depression: 26.3%
- Prevalence of frequent mental distress: 19.4%

13. Winston-Salem, NC
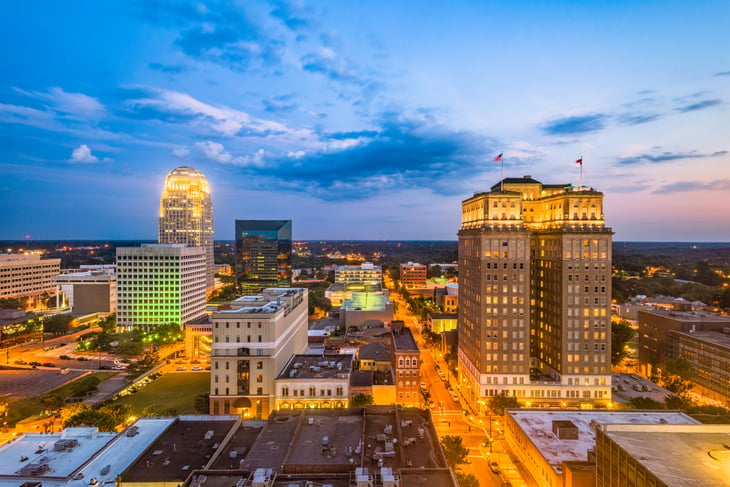
- Mental health workers per 10,000 population: 38.2
- Mental health employment share: 0.97%
- Total mental health workers: 2,630
- Prevalence of depression: 22.8%
- Prevalence of frequent mental distress: 15.8%
12. Greenville-Anderson-Mauldin, SC

- Mental health workers per 10,000 population: 38.2
- Mental health employment share: 0.87%
- Total mental health workers: 3,660
- Prevalence of depression: 22.9%
- Prevalence of frequent mental distress: 16.0%

11. Greensboro-High Point, NC
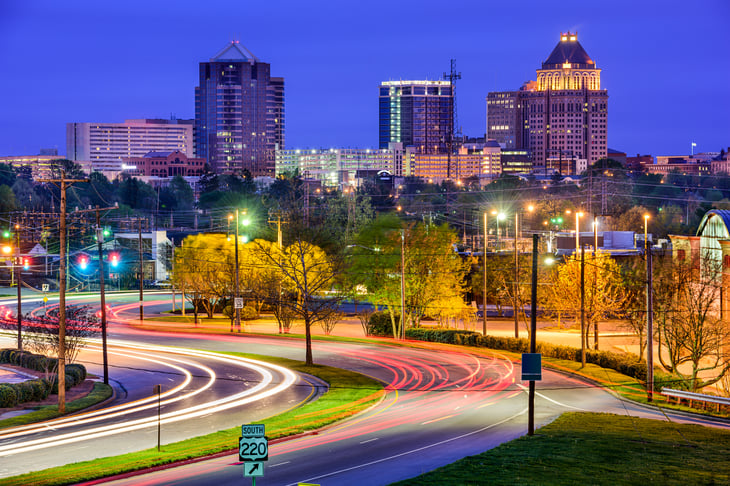
- Mental health workers per 10,000 population: 37.8
- Mental health employment share: 0.83%
- Total mental health workers: 2,960
- Prevalence of depression: 23.1%
- Prevalence of frequent mental distress: 16.9%
10. Houston-The Woodlands-Sugar Land, TX

- Mental health workers per 10,000 population: 36.9
- Mental health employment share: 0.85%
- Total mental health workers: 27,090
- Prevalence of depression: 20.5%
- Prevalence of frequent mental distress: 17.9%

9. Dallas-Fort Worth-Arlington, TX

- Mental health workers per 10,000 population: 36.6
- Mental health employment share: 0.73%
- Total mental health workers: 29,110
- Prevalence of depression: 20.6%
- Prevalence of frequent mental distress: 16.5%
8. Atlanta-Sandy Springs-Roswell, GA
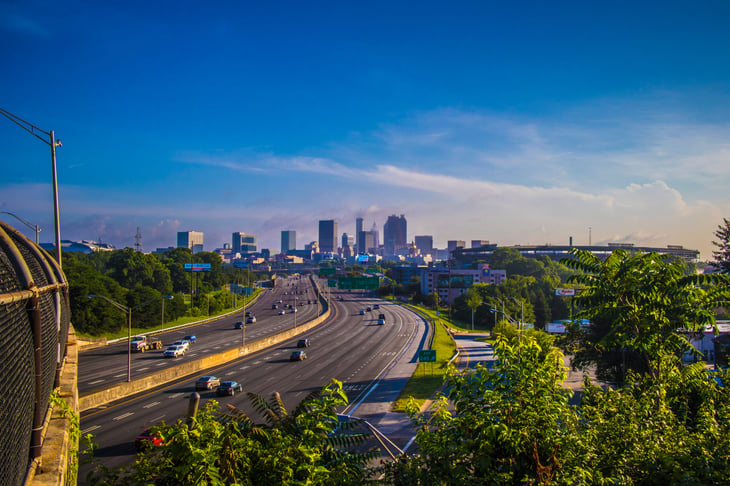
- Mental health workers per 10,000 population: 36.4
- Mental health employment share: 0.80%
- Total mental health workers: 22,670
- Prevalence of depression: 19.3%
- Prevalence of frequent mental distress: 15.6%

7. El Paso, TX
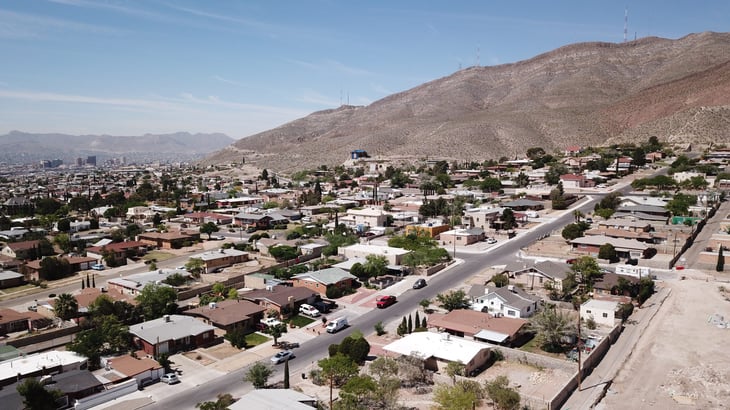
- Mental health workers per 10,000 population: 35.3
- Mental health employment share: 0.95%
- Total mental health workers: 3,080
- Prevalence of depression: 21.2%
- Prevalence of frequent mental distress: 18.3%
6. North Port-Sarasota-Bradenton, FL

- Mental health workers per 10,000 population: 35.1
- Mental health employment share: 0.97%
- Total mental health workers: 3,130
- Prevalence of depression: 18.6%
- Prevalence of frequent mental distress: 14.8%

5. McAllen-Edinburg-Mission, TX
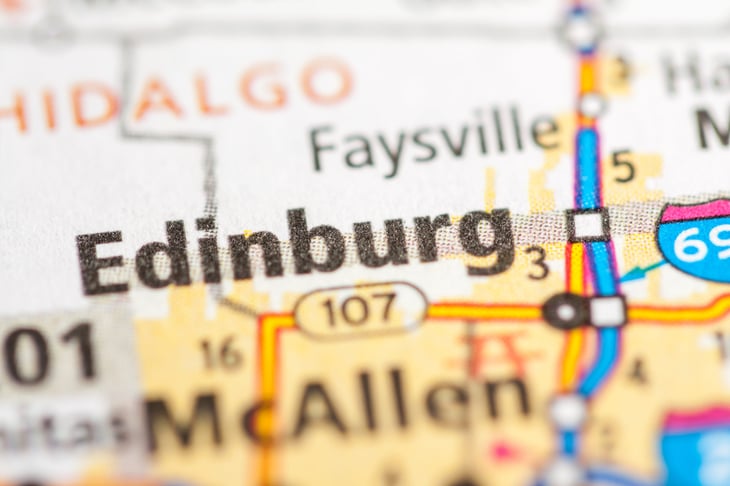
- Mental health workers per 10,000 population: 32.5
- Mental health employment share: 1.01%
- Total mental health workers: 2,890
- Prevalence of depression: 22.7%
- Prevalence of frequent mental distress: 20.4%
4. Cape Coral-Fort Myers, FL
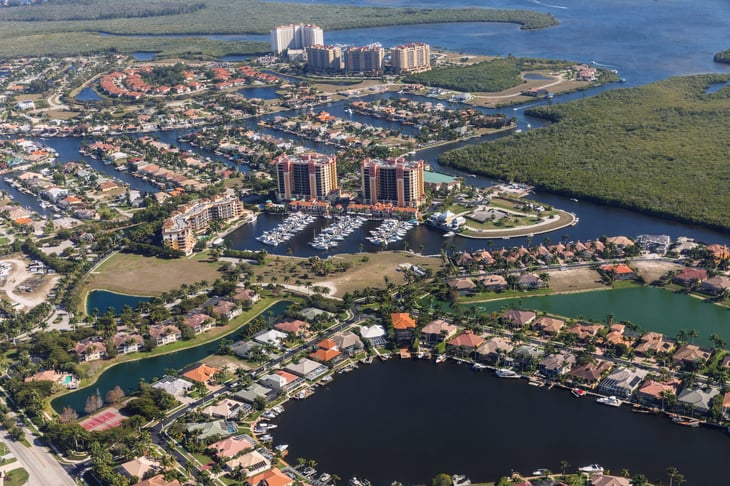
- Mental health workers per 10,000 population: 30.6
- Mental health employment share: 0.87%
- Total mental health workers: 2,520
- Prevalence of depression: 19.9%
- Prevalence of frequent mental distress: 15.4%

3. Lakeland-Winter Haven, FL

- Mental health workers per 10,000 population: 28.6
- Mental health employment share: 0.88%
- Total mental health workers: 2,250
- Prevalence of depression: 21.6%
- Prevalence of frequent mental distress: 18.3%
2. Huntsville, AL

- Mental health workers per 10,000 population: 27.6
- Mental health employment share: 0.57%
- Total mental health workers: 1,420
- Prevalence of depression: 23.1%
- Prevalence of frequent mental distress: 16.7%

1. Fayetteville-Springdale-Rogers, AR-MO

- Mental health workers per 10,000 population: 27.4
- Mental health employment share: 0.59%
- Total mental health workers: 1,580
- Prevalence of depression: 25.3%
- Prevalence of frequent mental distress: 18.2%
Methodology

This analysis identifies metropolitan areas with the largest shortages of mental health workers using data from multiple authoritative sources, including:
- The U.S. Bureau of Labor Statistics (BLS) Occupational Employment and Wage Statistics (OEWS)
- U.S. Census Bureau American Community Survey (ACS)
- Centers for Disease Control and Prevention (CDC) Behavioral Risk Factor Surveillance System (BRFSS)
- Substance Abuse and Mental Health Services Administration (SAMHSA) National Survey on Drug Use and Health (NSDUH)
- Health Resources and Services Administration (HRSA) Workforce Projections
To measure mental health workforce shortages, researchers at Addiction-Rep calculated the number of mental health professionals per 10,000 residents across major metropolitan statistical areas (MSAs) and states. For this study, mental health professionals were defined as individuals employed in the following occupations:
- Clinical and Counseling Psychologists
- School Psychologists
- Psychologists, All Other
- Educational, Guidance, and Career Counselors and Advisors
- Marriage and Family Therapists
- Rehabilitation Counselors
- Substance Abuse, Behavioral Disorder, and Mental Health Counselors
- Counselors, All Other
- Child, Family, and School Social Workers
- Healthcare Social Workers
- Mental Health and Substance Abuse Social Workers
- Social Workers, All Other
- Psychiatrists
- Psychiatric Technicians
- Psychiatric Aides
Mental health statistics reflect the adult population (ages 18 and over). The CDC defines the prevalence of depression as the percentage of individuals who have ever been diagnosed with a depressive disorder. The prevalence of frequent mental distress is determined by the percentage of respondents who reported experiencing poor mental health on at least 14 of the past 30 days.
To ensure consistency and accuracy, only metropolitan areas with complete data from all sources were included. Given variations in data collection periods, the presented statistics span 2022–2023, depending on geography and dataset availability. Additionally, to enhance the reliability of the metro-level estimates, only the 100 largest MSAs (by total employment) were analyzed.


Add a Comment