



Editor's Note: This story originally appeared on Construction Coverage.
One of the major economic stories in recent years has been the lasting impact of inflation. While year-over-year wage growth in the U.S. remains above pre-pandemic levels, the benefit of rising wages for most households has been limited by increasing prices in many consumer categories.
The U.S. Bureau of Labor Statistics is still reporting price increases of nearly 3% — notably above the 2% target inflation rate. Recent increases in the CPI primarily came from increases in the cost of dining out, utilities, and shelter.
The latter category tends to be a major pressure on household incomes. Housing is the largest regular expenditure for most households, so the failure of wages to keep up with housing prices can be especially burdensome. And since the onset of the pandemic, housing prices have skyrocketed, with the cost of homes sold in the U.S. increasing by approximately 45%.
The gap between income growth and rising housing costs isn’t new — it’s been widening for decades.
While sharp increases in home prices over the past five years have worsened affordability in many parts of the country, the most unaffordable states overall aren’t necessarily the ones with the biggest recent price spikes.
In fact, several of the states that top the list for housing unaffordability have had relatively modest home price growth in recent years compared to other states. However, their home prices were already exceptionally high to begin with.
At the city level, the situation is even more extreme.
Following is a breakdown of price-to-income ratios for major cities across the U.S. The analysis was conducted by Construction Coverage, using data from Zillow and the U.S. Census Bureau. For more detailed information, refer to the methodology section at the end.
20. Aurora, CO

- Home price-to-income ratio: 5.4
- Median home price: $480,667
- Median household income: $89,300
- 5-year change in median home price: +32.4%
- Mortgage holders spending >30% of income on housing: 37.1%
19. Mesa, AZ

- Home price-to-income ratio: 5.5
- Median home price: $436,165
- Median household income: $79,145
- 5-year change in median home price: +51.8%
- Mortgage holders spending >30% of income on housing: 27.1%
18. Sacramento, CA

- Home price-to-income ratio: 5.6
- Median home price: $480,407
- Median household income: $85,928
- 5-year change in median home price: +34.2%
- Mortgage holders spending >30% of income on housing: 33.6%
17. Washington, DC

- Home price-to-income ratio: 5.6
- Median home price: $602,135
- Median household income: $108,210
- 5-year change in median home price: +3.0%
- Mortgage holders spending >30% of income on housing: 23.3%
16. Fresno, CA

- Home price-to-income ratio: 5.7
- Median home price: $382,753
- Median household income: $67,603
- 5-year change in median home price: +46.2%
- Mortgage holders spending >30% of income on housing: 36.3%
15. Austin, TX
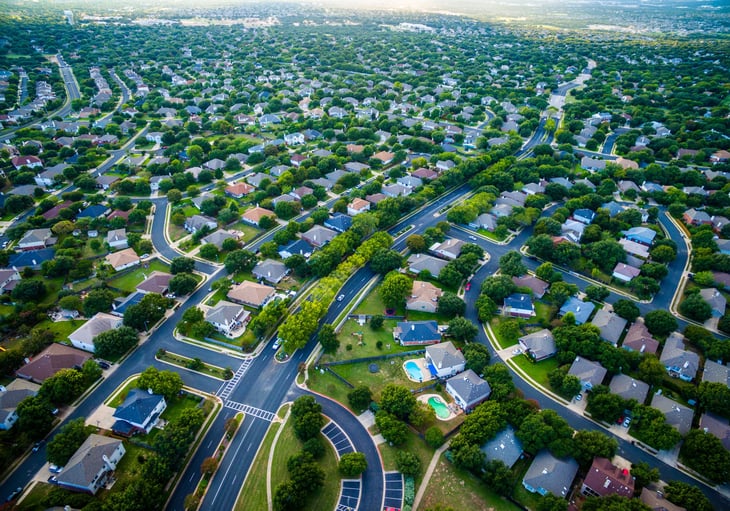
- Home price-to-income ratio: 5.7
- Median home price: $517,589
- Median household income: $91,501
- 5-year change in median home price: +32.2%
- Mortgage holders spending >30% of income on housing: 31.1%
14. Las Vegas, NV

- Home price-to-income ratio: 5.8
- Median home price: $426,132
- Median household income: $73,784
- 5-year change in median home price: +48.9%
- Mortgage holders spending >30% of income on housing: 32.2%

13. Tucson, AZ

- Home price-to-income ratio: 5.9
- Median home price: $327,578
- Median household income: $55,708
- 5-year change in median home price: +49.5%
- Mortgage holders spending >30% of income on housing: 26.7%
12. Denver, CO

- Home price-to-income ratio: 5.9
- Median home price: $552,056
- Median household income: $94,157
- 5-year change in median home price: +25.9%
- Mortgage holders spending >30% of income on housing: 26.7%
11. Portland, OR
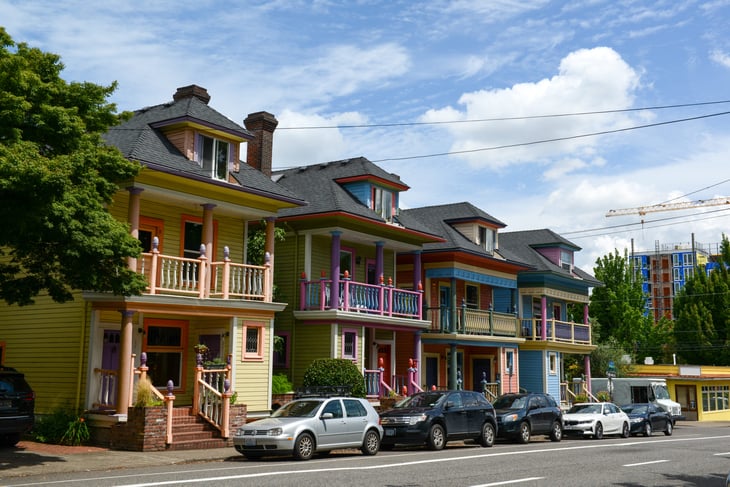
- Home price-to-income ratio: 6.2
- Median home price: $531,463
- Median household income: $86,057
- 5-year change in median home price: +18.4%
- Mortgage holders spending >30% of income on housing: 30.4%
10. Seattle, WA

- Home price-to-income ratio: 7.2
- Median home price: $871,963
- Median household income: $120,608
- 5-year change in median home price: +24.3%
- Mortgage holders spending >30% of income on housing: 23.7%
9. Oakland, CA

- Home price-to-income ratio: 7.7
- Median home price: $746,885
- Median household income: $96,828
- 5-year change in median home price: -0.4%
- Mortgage holders spending >30% of income on housing: 40.1%
8. Boston, MA

- Home price-to-income ratio: 7.7
- Median home price: $748,243
- Median household income: $96,931
- 5-year change in median home price: +17.8%
- Mortgage holders spending >30% of income on housing: 32.4%
7. Miami, FL

- Home price-to-income ratio: 8.5
- Median home price: $585,611
- Median household income: $68,635
- 5-year change in median home price: +64.9%
- Mortgage holders spending >30% of income on housing: 50.0%
6. San Diego, CA
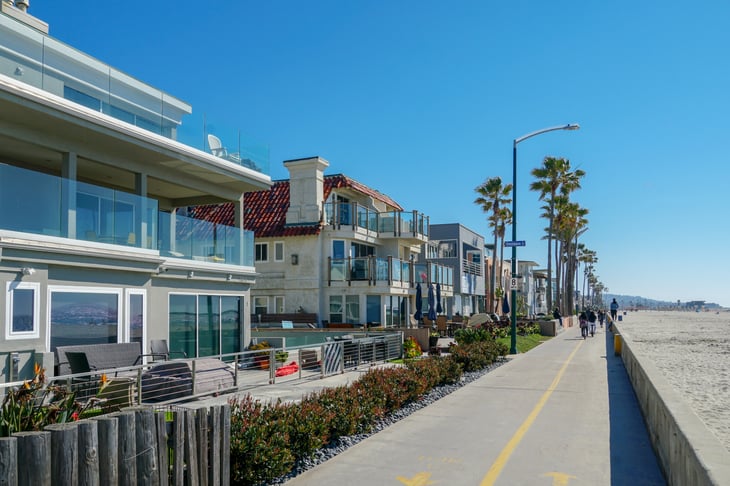
- Home price-to-income ratio: 9.6
- Median home price: $1,020,394
- Median household income: $105,780
- 5-year change in median home price: +56.1%
- Mortgage holders spending >30% of income on housing: 37.2%
5. New York, NY

- Home price-to-income ratio: 10.0
- Median home price: $763,358
- Median household income: $76,577
- 5-year change in median home price: +7.7%
- Mortgage holders spending >30% of income on housing: 43.1%
4. San Francisco, CA

- Home price-to-income ratio: 10.0
- Median home price: $1,272,219
- Median household income: $126,730
- 5-year change in median home price: -4.5%
- Mortgage holders spending >30% of income on housing: 38.2%
3. Long Beach, CA

- Home price-to-income ratio: 10.4
- Median home price: $852,090
- Median household income: $81,606
- 5-year change in median home price: +40.4%
- Mortgage holders spending >30% of income on housing: 38.7%
2. San Jose, CA
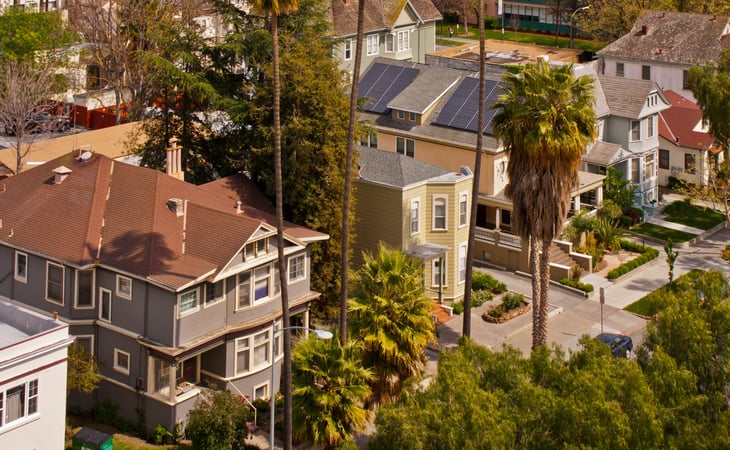
- Home price-to-income ratio: 11.0
- Median home price: $1,501,267
- Median household income: $136,229
- 5-year change in median home price: +49.6%
- Mortgage holders spending >30% of income on housing: 32.9%
1. Los Angeles, CA

- Home price-to-income ratio: 12.2
- Median home price: $973,393
- Median household income: $79,701
- 5-year change in median home price: +34.1%
- Mortgage holders spending >30% of income on housing: 45.4%
Methodology

The data used in this analysis is from Zillow’s Zillow Home Value Index (ZHVI) and the U.S. Census Bureau’s 2023 American Community Survey.
To find the locations with the highest price-to-income ratios, researchers from Construction Coverage ranked locations by the median home price divided by the median annual household income.
In the event of a tie, the location with the larger median home price was ranked higher.
Home price data reflects the most recent Zillow Home Value Index (ZHVI) as of February 2025, with five-year price changes calculated from February 2020 to February 2025. Median household income figures are from 2023, the most recent year available.
To ensure accuracy and relevance, the analysis includes only cities with an income margin of error below 10%.

Add a Comment