


Editor's Note: This story originally appeared on Construction Coverage.
Nearly two years into the coronavirus pandemic, the ongoing spread of COVID-19 and an uneven economic recovery have hobbled some sectors while others continue to experience rapid growth. One of the industries in the latter group is construction.
Recent data from the U.S. Census Bureau found that seasonally-adjusted U.S. spending on construction increased by 9.3% from November 2020 to November 2021. Both supply and demand are helping drive spending upward.
On the supply side, building materials have seen increases in prices amid ongoing supply chain struggles, and the cost of labor has also increased as employers look to compete for workers in a tight labor market. On the demand side, many consumers and businesses are flush with cash due in part to aggressive fiscal relief from the federal government and strong economic performance in some sectors, which has given them the means to invest in major expenses like construction.
To identify the construction sectors with the biggest increase in spending since the pandemic started, researchers at Construction Coverage calculated the percentage change in annualized spending between January 2020 and November of 2021. The data used in this analysis is from the U.S. Census Bureau. Researchers also included the total change in spending on an annualized basis.
Here are the construction sectors with the biggest increase in spending since the pandemic.
15. Air transportation
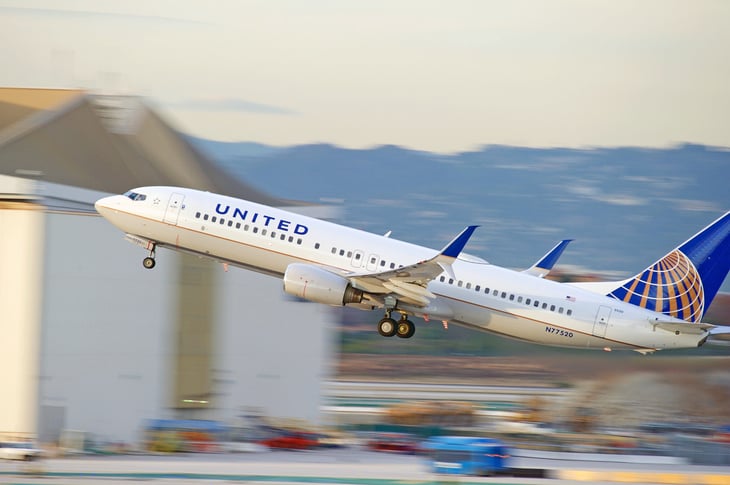
- Percentage change in spending since January 2020: +4.0%
- Total change in spending since January 2020: +$145,000,000
- Total spending (current): $3,784,000,000
- Total spending (January 2020): $3,639,000,000
- Description: Passenger terminals, runways, pavement and lighting, hangars, air freight terminals, space facilities, air traffic towers, aircraft storage and maintenance buildings
14. Medical buildings
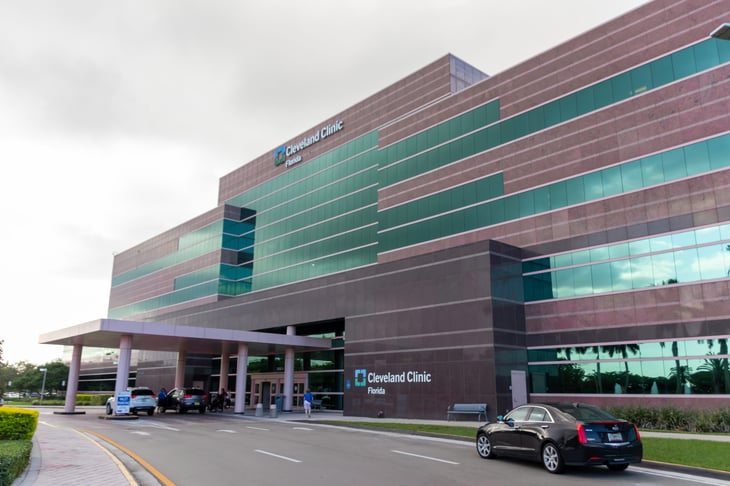
- Percentage change in spending since January 2020: +4.4%
- Total change in spending since January 2020: +$559,000,000
- Total spending (current): $13,365,000,000
- Total spending (January 2020): $12,806,000,000
- Description: Clinics, medical offices, medical labs, doctor and dentist offices, outpatient clinics, and research labs
13. Parking lots & garages
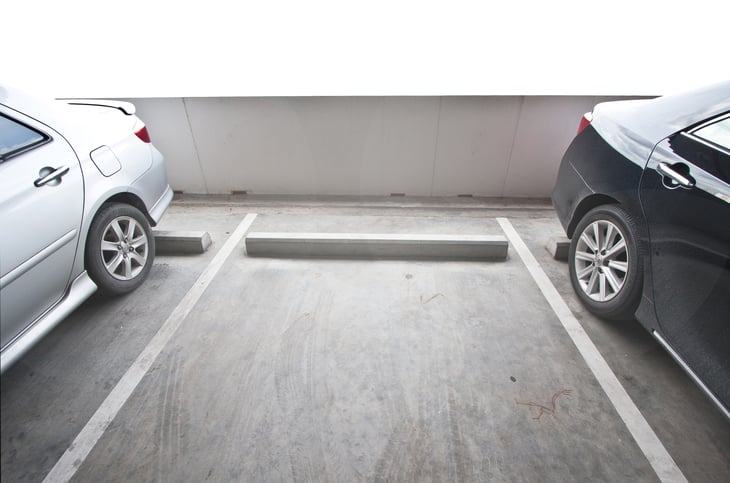
- Percentage change in spending since January 2020: +4.8%
- Total change in spending since January 2020: +$69,000,000
- Total spending (current): $1,500,000,000
- Total spending (January 2020): $1,431,000,000
- Description: Commercial parking lots and parking garages
12. Galleries & museums
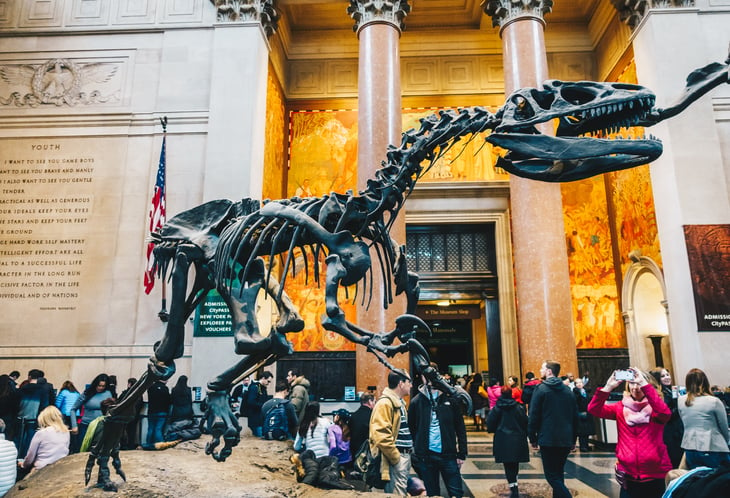
- Percentage change in spending since January 2020: +5.9%
- Total change in spending since January 2020: +$93,000,000
- Total spending (current): $1,678,000,000
- Total spending (January 2020): $1,585,000,000
- Description: Art galleries, cultural centers, and museums
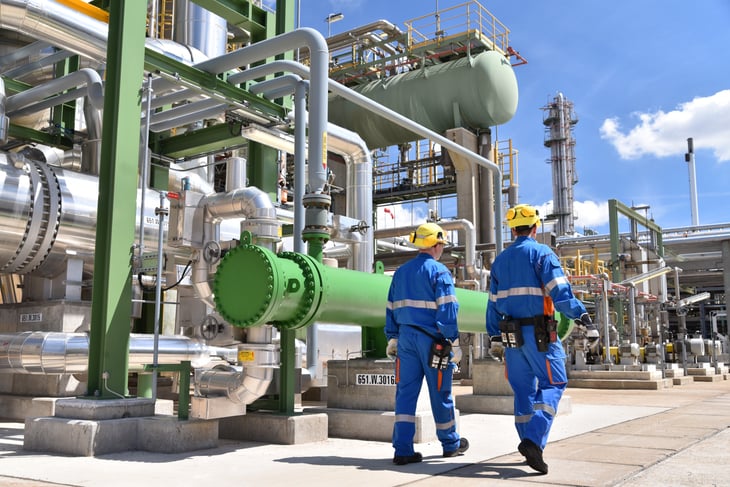
11. Chemical manufacturing
- Percentage change in spending since January 2020: +6.7%
- Total change in spending since January 2020: +$1,931,000,000
- Total spending (current): $30,645,000,000
- Total spending (January 2020): $28,714,000,000
- Description: Chemical industries transform organic and inorganic raw materials by a chemical process and form products.
10. Social centers & clubs

- Percentage change in spending since January 2020: +8.9%
- Total change in spending since January 2020: +$152,000,000
- Total spending (current): $1,851,000,000
- Total spending (January 2020): $1,699,000,000
- Description: Neighborhood centers, banquet halls, lodge buildings, golf courses, community houses, community centers, fraternal halls, and country clubs
9. Building supply stores

- Percentage change in spending since January 2020: +13.0%
- Total change in spending since January 2020: +$122,000,000
- Total spending (current): $1,063,000,000
- Total spending (January 2020): $941,000,000
- Description: Hardware stores and lumber yards
8. General merchandise retail stores

- Percentage change in spending since January 2020: +22.1%
- Total change in spending since January 2020: +$486,000,000
- Total spending (current): $2,681,000,000
- Total spending (January 2020): $2,195,000,000
- Description: Department stores and variety stores
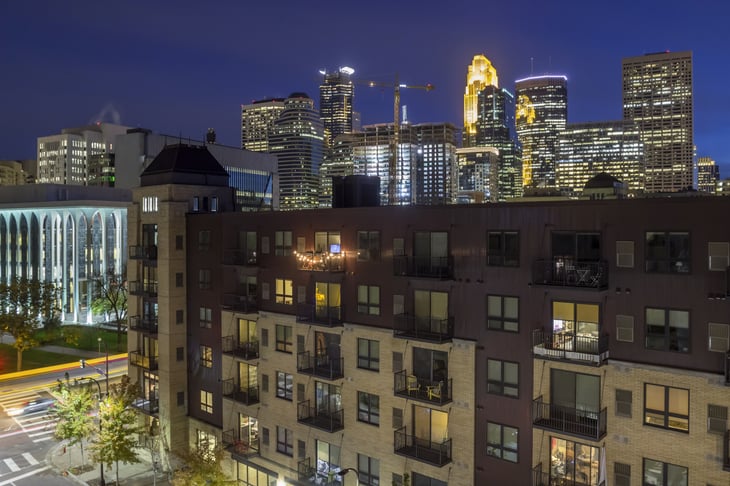
7. New multifamily residential
- Percentage change in spending since January 2020: +23.4%
- Total change in spending since January 2020: +$18,972,000,000
- Total spending (current): $99,999,000,000
- Total spending (January 2020): $81,027,000,000
- Description: New apartments and condominiums, excluding residential units in buildings that are primarily nonresidential
6. Commercial warehouses

- Percentage change in spending since January 2020: +27.5%
- Total change in spending since January 2020: +$10,024,000,000
- Total spending (current): $46,510,000,000
- Total spending (January 2020): $36,486,000,000
- Description: Commercial warehouses, storage warehouses, and distribution buildings
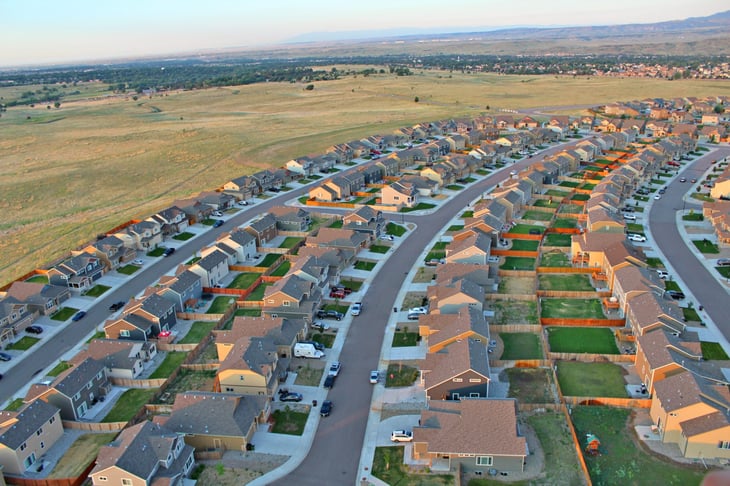
5. New single-family residential
- Percentage change in spending since January 2020: +40.8%
- Total change in spending since January 2020: +$122,075,000,000
- Total spending (current): $421,048,000,000
- Total spending (January 2020): $298,973,000,000
- Description: New houses and townhouses built to be sold or rented and units built by the owner or for the owner on contract; excludes residential units in buildings that are primarily nonresidential, manufactured housing, and houseboats
4. Computer, electronic & electrical manufacturing

- Percentage change in spending since January 2020: +42.8%
- Total change in spending since January 2020: +$4,049,000,000
- Total spending (current): $13,507,000,000
- Total spending (January 2020): $9,458,000,000
- Description: Computers, computer peripherals and similar electronic products, products that generate and distribute electrical power, electric lighting equipment, household appliances, and other electrical equipment and components.
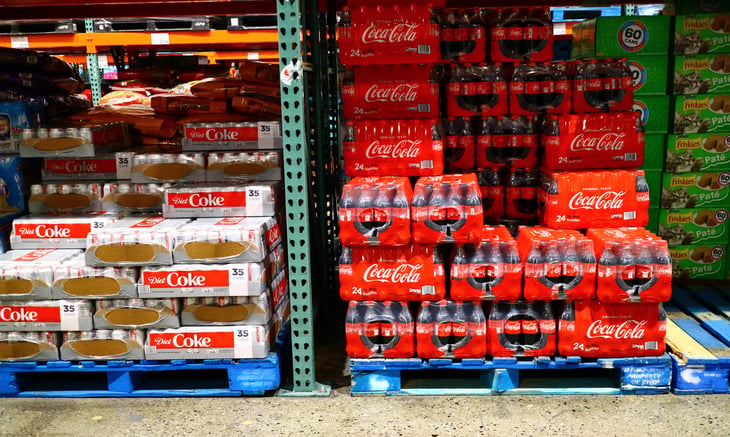
3. Food, beverage & tobacco manufacturing
- Percentage change in spending since January 2020: +47.5%
- Total change in spending since January 2020: +$3,377,000,000
- Total spending (current): $10,480,000,000
- Total spending (January 2020): $7,103,000,000
- Description: All food and beverage products for intermediate or final consumption, as well as tobacco and tobacco products
2. Nonmetallic mineral manufacturing

- Percentage change in spending since January 2020: +59.5%
- Total change in spending since January 2020: +$505,000,000
- Total spending (current): $1,354,000,000
- Total spending (January 2020): $849,000,000
- Description: Nonmetallic mineral industries transform mined or quarried nonmetallic minerals, such as sand, gravel, stone, clay, and refractory materials, into products for intermediate or final consumption.
1. Fabricated metal manufacturing

- Percentage change in spending since January 2020: +72.6%
- Total change in spending since January 2020: +$942,000,000
- Total spending (current): $2,239,000,000
- Total spending (January 2020): $1,297,000,000
- Description: Fabricated metal industries transform metal into intermediate or end products, excluding machinery, computers, electronics, and metal furniture.
Methodology

The data used in this analysis is from the U.S. Census Bureau’s Value of Construction Put in Place Survey, which provides monthly estimates of the total dollar value of construction work done in the U.S.
To identify the sectors with the biggest increase in spending since the pandemic started, researchers calculated the percentage change in spending (seasonally-adjusted annual rate) between January 2020 and November of 2021. Researchers also included the total change in spending on an annualized basis. More complete descriptions of the sectors included in this study can be found here.
Add a Comment
Our Policy: We welcome relevant and respectful comments in order to foster healthy and informative discussions. All other comments may be removed. Comments with links are automatically held for moderation.