



Editor's Note: This story originally appeared on Cinch.
Rodent infestations have become an unwelcome reality for millions of Americans.
Rodents bring more than just annoyance; they pose significant health and safety risks. According to the Centers for Disease Control and Prevention (CDC), rats and mice can spread diseases such as hantavirus, leptospirosis, and salmonella through their droppings, urine, and nests.
They also worsen asthma and allergies, particularly in children. Beyond health hazards, rodents cause structural damage by gnawing through walls, wiring, and insulation — sometimes even sparking electrical fires.
Rodent infestations are strongly linked to the age of housing stock, with older homes showing a higher prevalence of infestations.
To identify the locations with the most severe rodent problems, researchers at Cinch analyzed data from the U.S. Census Bureau. See the methodology section at the end for more details.
Here are the U.S. counties with the worst rodent infestations.
15. New York County, NY

- Metro: New York City-Newark-Jersey City, NY-NJ
- Share of homes with rodents: 14.7%
- Estimated number of homes with rodents: 131,139
- Estimated population living in homes with rodents: 239,285
- Median year home built: 1951
- Share of population in urban areas: 100%
14. Baltimore City, MD

- Metro: Baltimore-Columbia-Towson, MD
- Share of homes with rodents: 14.9%
- Estimated number of homes with rodents: 43,703
- Estimated population living in homes with rodents: 86,002
- Median year home built: 1948
- Share of population in urban areas: 100%

13. Kings County, NY

- Metro: New York City-Newark-Jersey City, NY-NJ
- Share of homes with rodents: 15%
- Estimated number of homes with rodents: 160,170
- Estimated population living in homes with rodents: 396,946
- Median year home built: 1943
- Share of population in urban areas: 100%

12. Middlesex County, MA

- Metro: Boston-Cambridge-Newton, MA-NH
- Share of homes with rodents: 15.1%
- Estimated number of homes with rodents: 97,583
- Estimated population living in homes with rodents: 245,057
- Median year home built: 1961
- Share of population in urban areas: 96.5%
11. Hennepin County, MN

- Metro: Minneapolis-St. Paul-Bloomington, MN-WI
- Share of homes with rodents: 16.2%
- Estimated number of homes with rodents: 87,916
- Estimated population living in homes with rodents: 205,562
- Median year home built: 1973
- Share of population in urban areas: 97.6%

10. Camden County, NJ

- Metro: Philadelphia-Camden-Wilmington, PA-NJ-DE-MD
- Share of homes with rodents: 16.4%
- Estimated number of homes with rodents: 33,780
- Estimated population living in homes with rodents: 85,943
- Median year home built: 1966
- Share of population in urban areas: 98.7%

9. Kent County, MI
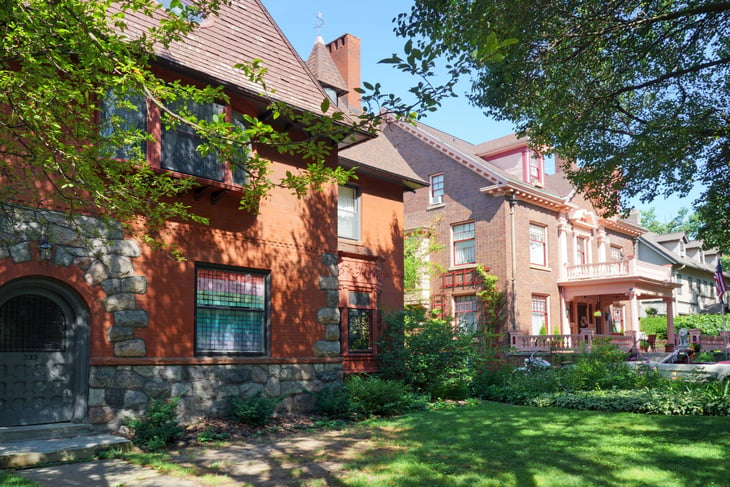
- Metro: Grand Rapids-Wyoming-Kentwood, MI
- Share of homes with rodents: 16.5%
- Estimated number of homes with rodents: 42,869
- Estimated population living in homes with rodents: 108,709
- Median year home built: 1976
- Share of population in urban areas: 83.8%
8. Worcester County, MA

- Metro: Worcester, MA
- Share of homes with rodents: 17.4%
- Estimated number of homes with rodents: 58,865
- Estimated population living in homes with rodents: 149,930
- Median year home built: 1966
- Share of population in urban areas: 78.8%
7. Ramsey County, MN

- Metro: Minneapolis-St. Paul-Bloomington, MN-WI
- Share of homes with rodents: 17.5%
- Estimated number of homes with rodents: 38,762
- Estimated population living in homes with rodents: 95,277
- Median year home built: 1965
- Share of population in urban areas: 100%

6. Delaware County, PA

- Metro: Philadelphia-Camden-Wilmington, PA-NJ-DE-MD
- Share of homes with rodents: 19.1%
- Estimated number of homes with rodents: 43,046
- Estimated population living in homes with rodents: 110,053
- Median year home built: 1957
- Share of population in urban areas: 99.2%

5. Suffolk County, MA

- Metro: Boston-Cambridge-Newton, MA-NH
- Share of homes with rodents: 19.5%
- Estimated number of homes with rodents: 67,411
- Estimated population living in homes with rodents: 152,524
- Median year home built: 1948
- Share of population in urban areas: 100%
4. Essex County, MA

- Metro: Boston-Cambridge-Newton, MA-NH
- Share of homes with rodents: 20.1%
- Estimated number of homes with rodents: 63,218
- Estimated population living in homes with rodents: 162,259
- Median year home built: 1960
- Share of population in urban areas: 94.9%

3. District of Columbia, DC
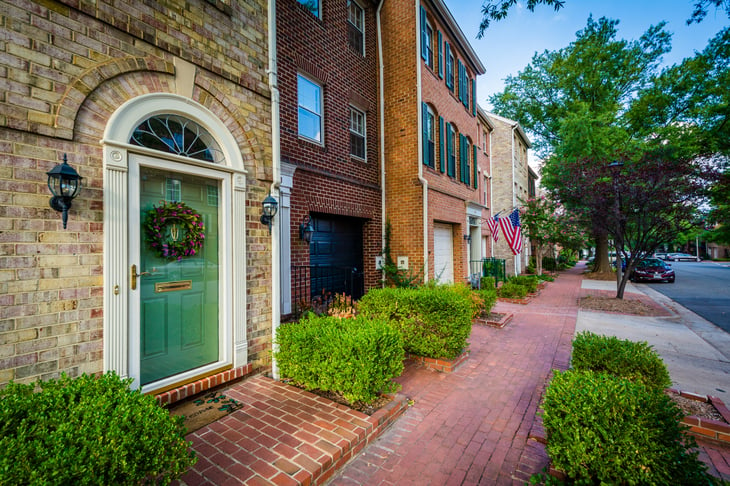
- Metro: Washington-Arlington-Alexandria, DC-VA-MD-WV
- Share of homes with rodents: 20.5%
- Estimated number of homes with rodents: 66,207
- Estimated population living in homes with rodents: 137,776
- Median year home built: 1957
- Share of population in urban areas: 100%

2. Summit County, OH

- Metro: Akron, OH
- Share of homes with rodents: 21.8%
- Estimated number of homes with rodents: 53,757
- Estimated population living in homes with rodents: 117,303
- Median year home built: 1965
- Share of population in urban areas: 96.2%
1. Philadelphia County, PA

- Metro: Philadelphia-Camden-Wilmington, PA-NJ-DE-MD
- Share of homes with rodents: 29.6%
- Estimated number of homes with rodents: 204,708
- Estimated population living in homes with rodents: 468,400
- Median year home built: 1949
- Share of population in urban areas: 100%

Methodology

To identify the locations with the most severe rodent problems, researchers at Cinch calculated the percentage of households that reported signs of mice or rats inside the home within the prior 12 months.
In the event of a tie, locations with a higher total number of households with reported rodent sightings were ranked higher.
Cinch also estimated the total number of individuals living in households with rodent activity by multiplying the percentage of affected households by the total population in each location.
To provide additional context, statistics on home age and urbanization levels were included in the analysis.
Counties with populations below 1,000 were excluded. The analysis utilized the most recent data available from the U.S. Census Bureau’s American Housing Survey, American Community Survey 5-Year Estimates, and Geography Program.


Add a Comment