



Editor's Note: This story originally appeared on LawnStarter.
Which parts of the U.S. are most vulnerable to flood damage?
To find out, LawnStarter ranked the U.S. counties most at risk for flooding.
We compared over 940 counties with a relatively moderate to very high flood risk according to the Federal Emergency Management Agency (FEMA).
We considered each county’s risk and expected annual loss from riverine and coastal flooding. We also looked at the share of populations of children, elderly, and residents in mobile homes, in addition to local demand for flood insurance.
The following is our ranking of the counties most vulnerable to flooding. To learn how we ranked the counties, see our methodology at the end.
15. St. Martin Parish, LA

- Overall Score: 48.97
- Flood Risk Rank: 25
- Economic Impact Rank: 58
- Preparedness Rank: 407
- Population Vulnerability Rank: 85
14. St. Mary Parish, LA

- Overall Score: 48.97
- Flood Risk Rank: 20
- Economic Impact Rank: 78
- Preparedness Rank: 407
- Population Vulnerability Rank: 111
13. Coos County, OR

- Overall Score: 49.31
- Flood Risk Rank: 13
- Economic Impact Rank: 29
- Preparedness Rank: 517
- Population Vulnerability Rank: 218
12. Dixie County, FL

- Overall Score: 49.53
- Flood Risk Rank: 94
- Economic Impact Rank: 294
- Preparedness Rank: 28
- Population Vulnerability Rank: 7

11. Philadelphia County, PA

- Overall Score: 49.63
- Flood Risk Rank: 9
- Economic Impact Rank: 27
- Preparedness Rank: 56
- Population Vulnerability Rank: 834
10. Brevard County, FL

- Overall Score: 50.12
- Flood Risk Rank: 35
- Economic Impact Rank: 72
- Preparedness Rank: 10
- Population Vulnerability Rank: 512
9. St. Johns County, FL

- Overall Score: 50.24
- Flood Risk Rank: 22
- Economic Impact Rank: 57
- Preparedness Rank: 15
- Population Vulnerability Rank: 683
8. Miami-Dade County, FL
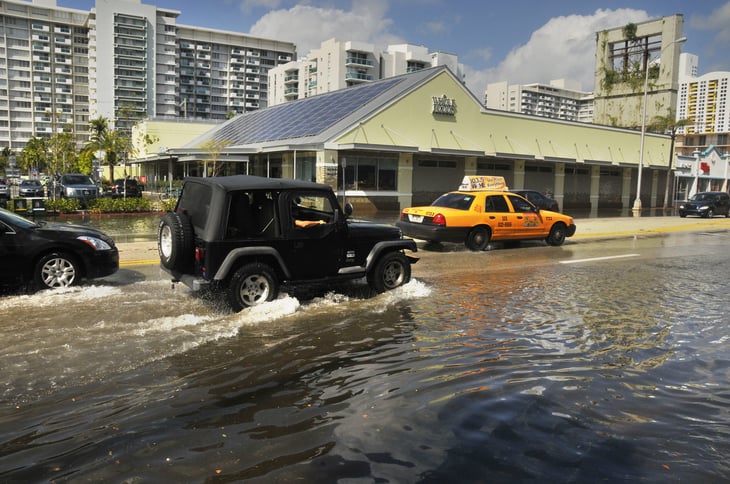
- Overall Score: 50.29
- Flood Risk Rank: 50
- Economic Impact Rank: 16
- Preparedness Rank: 2
- Population Vulnerability Rank: 848
7. Volusia County, FL

- Overall Score: 50.38
- Flood Risk Rank: 32
- Economic Impact Rank: 98
- Preparedness Rank: 10
- Population Vulnerability Rank: 432
6. Cameron County, TX

- Overall Score: 51.74
- Flood Risk Rank: 3
- Economic Impact Rank: 20
- Preparedness Rank: 206
- Population Vulnerability Rank: 348
5. Cape May County, NJ

- Overall Score: 52.43
- Flood Risk Rank: 11
- Economic Impact Rank: 6
- Preparedness Rank: 358
- Population Vulnerability Rank: 430
4. Atlantic County, NJ

- Overall Score: 53.58
- Flood Risk Rank: 2
- Economic Impact Rank: 5
- Preparedness Rank: 352
- Population Vulnerability Rank: 672
3. Ocean County, NJ

- Overall Score: 57.67
- Flood Risk Rank: 1
- Economic Impact Rank: 3
- Preparedness Rank: 339
- Population Vulnerability Rank: 212
2. Bergen County, NJ

- Overall Score: 60.98
- Flood Risk Rank: 7
- Economic Impact Rank: 1
- Preparedness Rank: 333
- Population Vulnerability Rank: 876
1. Harris County, TX
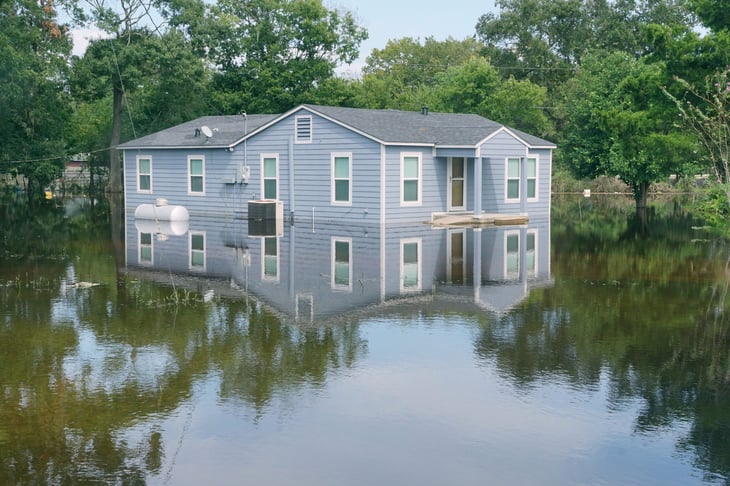
- Overall Score: 63.87
- Flood Risk Rank: 56
- Economic Impact Rank: 2
- Preparedness Rank: 1
- Population Vulnerability Rank: 744
Methodology

First, we determined the factors (metrics) that are most relevant to rank the counties most at risk for flooding.
We then assigned a weight to each factor based on its importance and grouped those factors into four categories: Flood Risk, Economic Impact, Preparedness, and Population Vulnerability. Here are the factors:
- Riverine Flooding Risk Score
- Coastal Flooding Risk Score
- Coastal Flooding – Expected Annual Loss – Total
- Riverine Flooding – Expected Annual Loss – Total
- Share of Mobile Homes
- Percentage of People 60 Years and Over
- Percentage of Children Under 5
- Google Searches – Flood Insurance
- Flood Insurance Providers
For each of the 943 counties with a relatively moderate to very high risk of coastal and/or riverine flooding according to FEMA, we then gathered data on each factor.
Finally, we calculated scores (out of 100 points) for each county to determine its rank in each factor, each category, and overall. A county’s Overall Score is the average of its scores across all factors and categories. The highest Overall Score ranked “Best” (No. 1).

Add a Comment