



Editor's Note: This story originally appeared on ETQ.
The United States is undergoing a manufacturing revival, driven by efforts to reshore critical industries, strengthen supply chain resilience, and expand domestic employment. Yet how many jobs this resurgence will actually create remains unclear.
A recent study by Deloitte and The Manufacturing Institute projected demand for up to 3.8 million new manufacturing workers between 2024 and 2033, with roughly half of those positions at risk of going unfilled due to persistent talent shortages.
In contrast, the U.S. Bureau of Labor Statistics (BLS) forecasts a much smaller increase — just 110,000 new manufacturing jobs by 2033. Meanwhile, our independent analysis of state-level projections compiled from state labor departments estimates a combined 10-year manufacturing employment growth of about 400,000 jobs nationally.
This wide range of estimates reflects the uncertainty surrounding the future of the sector. Job growth will likely depend on the success of federal industrial policy, including recent efforts to boost domestic production of semiconductors and energy technologies, as well as on how effectively automation and advanced technologies can bridge current workforce gaps.
While manufacturing productivity has grown — real manufacturing GDP increased 45% since 2000 — the sector has shed over 4.5 million jobs during that time, highlighting a growing disconnect between output and employment.
To better understand where manufacturing may contribute most to future job growth, ETQ researchers analyzed the latest workforce projections from 49 state labor departments, covering 2022–2032 or 2023–2033, depending on the state. The data offer a view of projected growth in manufacturing employment relative to overall job creation.
Here are the top states where manufacturing jobs stand to grow the most.
10. South Carolina

- Projected change in manufacturing employment (%): +8.5%
- Projected change in manufacturing employment (number): +22,071
- Manufacturing employment (base year): 261,052
- Manufacturing employment (projection year): 283,123
- Projected change in total employment (%): +11.1%
- Projected change in total employment (number): +261,744
- Total employment (base year): 2,352,883
- Total employment (projected year): 2,614,627
- Projection time period: 2022–2032
9. Georgia

- Projected change in manufacturing employment (%): +8.9%
- Projected change in manufacturing employment (number): +36,600
- Manufacturing employment (base year): 409,590
- Manufacturing employment (projection year): 446,190
- Projected change in total employment (%): +11.0%
- Projected change in total employment (number): +539,350
- Total employment (base year): 4,884,460
- Total employment (projected year): 5,423,810
- Projection time period: 2022–2032
8. New Mexico

- Projected change in manufacturing employment (%): +10.7%
- Projected change in manufacturing employment (number): +3,075
- Manufacturing employment (base year): 28,675
- Manufacturing employment (projection year): 31,750
- Projected change in total employment (%): +10.6%
- Projected change in total employment (number): +95,632
- Total employment (base year): 905,770
- Total employment (projected year): 1,001,402
- Projection time period: 2023–2033
7. Nevada
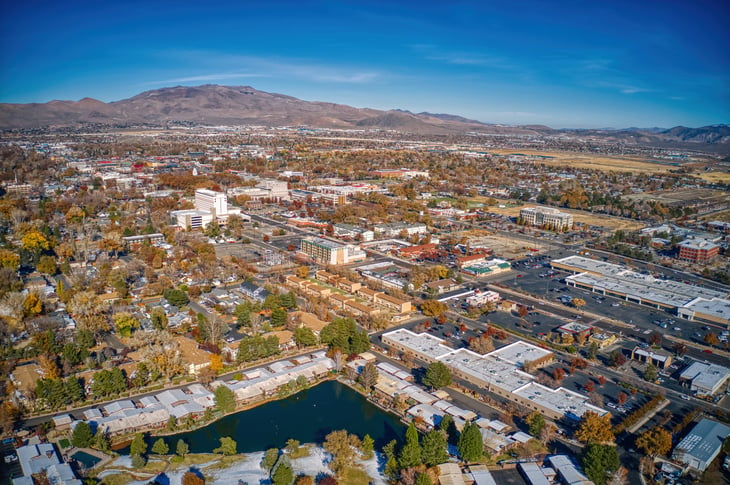
- Projected change in manufacturing employment (%): +10.7%
- Projected change in manufacturing employment (number): +6,897
- Manufacturing employment (base year): 64,225
- Manufacturing employment (projection year): 71,122
- Projected change in total employment (%): +14.2%
- Projected change in total employment (number): +217,818
- Total employment (base year): 1,534,673
- Total employment (projected year): 1,752,491
- Projection time period: 2022–2032
6. Delaware

- Projected change in manufacturing employment (%): +12.2%
- Projected change in manufacturing employment (number): +3,180
- Manufacturing employment (base year): 26,010
- Manufacturing employment (projection year): 29,190
- Projected change in total employment (%): +7.3%
- Projected change in total employment (number): +36,240
- Total employment (base year): 496,990
- Total employment (projected year): 533,230
- Projection time period: 2022–2032
5. Wyoming
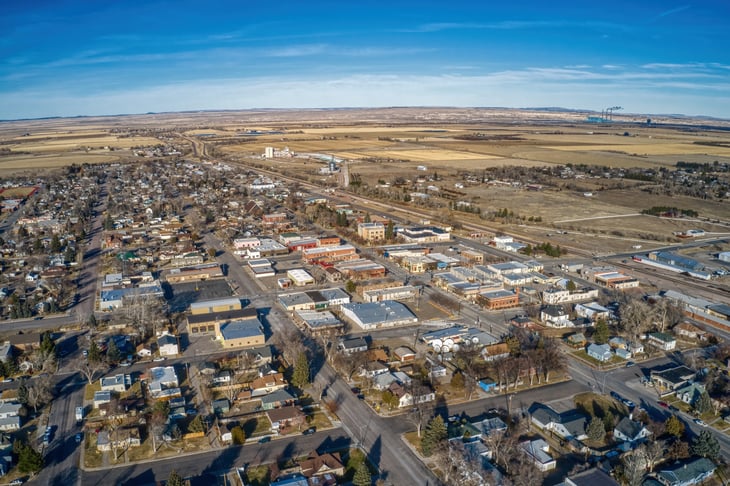
- Projected change in manufacturing employment (%): +13.1%
- Projected change in manufacturing employment (number): +1,340
- Manufacturing employment (base year): 10,201
- Manufacturing employment (projection year): 11,541
- Projected change in total employment (%): +12.1%
- Projected change in total employment (number): +33,247
- Total employment (base year): 274,118
- Total employment (projected year): 307,365
- Projection time period: 2022–2032
4. Alaska

- Projected change in manufacturing employment (%): +14.3%
- Projected change in manufacturing employment (number): +1,769
- Manufacturing employment (base year): 12,380
- Manufacturing employment (projection year): 14,149
- Projected change in total employment (%): +6.9%
- Projected change in total employment (number): +22,097
- Total employment (base year): 319,345
- Total employment (projected year): 341,442
- Projection time period: 2022–2032

3. Idaho

- Projected change in manufacturing employment (%): +15.0%
- Projected change in manufacturing employment (number): +10,937
- Manufacturing employment (base year): 72,753
- Manufacturing employment (projection year): 83,690
- Projected change in total employment (%): +13.8%
- Projected change in total employment (number): +120,939
- Total employment (base year): 875,946
- Total employment (projected year): 996,885
- Projection time period: 2022–2032
2. Arizona

- Projected change in manufacturing employment (%): +16.2%
- Projected change in manufacturing employment (number): +31,504
- Manufacturing employment (base year): 194,618
- Manufacturing employment (projection year): 226,122
- Projected change in total employment (%): +14.2%
- Projected change in total employment (number): +486,348
- Total employment (base year): 3,434,790
- Total employment (projected year): 3,921,138
- Projection time period: 2023–2033
1. Utah

- Projected change in manufacturing employment (%): +16.6%
- Projected change in manufacturing employment (number): +25,180
- Manufacturing employment (base year): 151,610
- Manufacturing employment (projection year): 176,790
- Projected change in total employment (%): +23.1%
- Projected change in total employment (number): +404,420
- Total employment (base year): 1,748,840
- Total employment (projected year): 2,153,260
- Projection time period: 2022–2032
Methodology

To determine where manufacturing jobs are projected to grow the most, ETQ compiled state-level employment projections from each state’s labor department or workforce agency.
Because these projections are not maintained in a centralized database, data were manually collected from official state sources. A list of these websites can be found at Projections Central. The most recent 10-year projections available were used, covering either 2022–2032 or 2023–2033, depending on the state.
For each state, ETQ calculated the absolute and percentage change in manufacturing employment over the projection period. Total employment projections were also collected to provide context for manufacturing growth relative to broader job trends. Kentucky was excluded from the analysis due to unavailable data.

Add a Comment