


Editor's Note: This story originally appeared on Trace One.
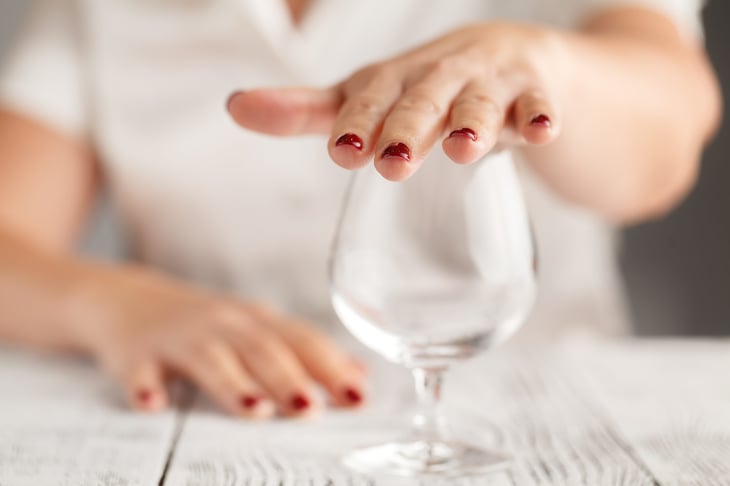
Alcohol consumption in the United States has shifted noticeably in recent years, with a growing share of adults choosing to drink less or not at all.
Public health experts point to a combination of factors driving this trend, including increased awareness of alcohol’s health risks, the expansion of cannabis legalization, and changes in social habits as more young people connect online rather than in person.
Shifting cultural norms, a broader focus on wellness, and evolving alcohol beverage labeling requirements have also played a role in reshaping drinking behaviors and consumer choices across the country.
At the same time, the market for alcohol alternatives has expanded rapidly.
Internet searches for products such as non-alcoholic beer, zero-proof cocktails, and other alcohol-free beverages have surged, reflecting both consumer curiosity and growing retail availability. Beverage companies have responded by rolling out new product lines and catering to consumers who want the taste and social experience of drinking without the intoxicating effects.
This report, conducted by the food and beverage software company Trace One, uses data from the Substance Abuse and Mental Health Services Administration (SAMHSA) to examine trends in alcohol use.
It compares current alcohol use rates across states and examines how those rates have changed over time. Learn more about the methodology at the end.
Here are the states with the biggest drops in alcohol consumption.
10. Hawaii

- Change from peak year: -9.6 pp
- 10-year change: -8.2 pp
- Share of adults who drink (2024): 45.0%
- Share of adults who drink (2014): 53.1%
- Share of adults who drink (peak year): 54.5%
- Peak year: 2012
9. Alaska
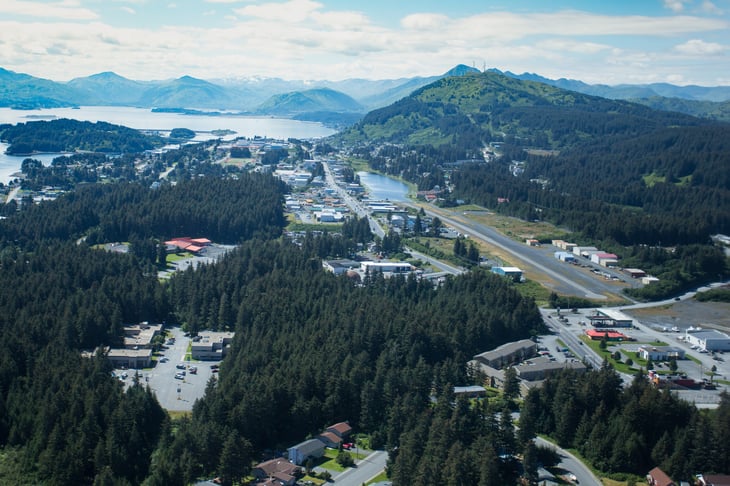
- Change from peak year: -9.6 pp
- 10-year change: -8.7 pp
- Share of adults who drink (2024): 50.5%
- Share of adults who drink (2014): 59.1%
- Share of adults who drink (peak year): 60.0%
- Peak year: 2008
8. South Dakota
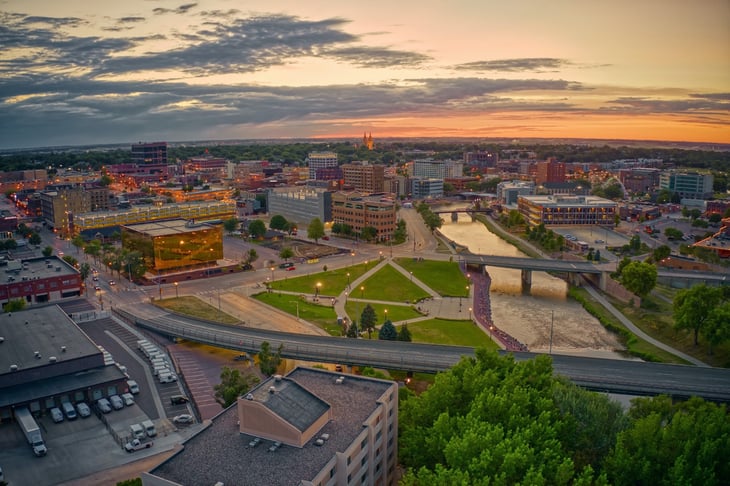
- Change from peak year: -10.2 pp
- 10-year change: -5.6 pp
- Share of adults who drink (2024): 54.4%
- Share of adults who drink (2014): 60.1%
- Share of adults who drink (peak year): 64.6%
- Peak year: 2017
7. Minnesota
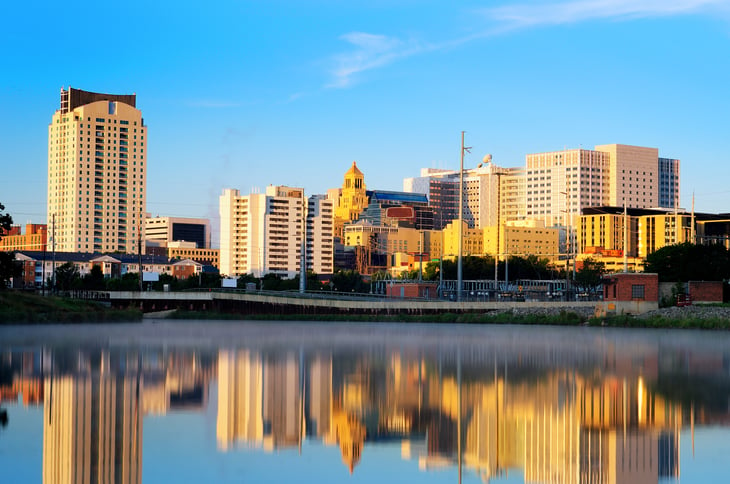
- Change from peak year: -10.2 pp
- 10-year change: -6.3 pp
- Share of adults who drink (2024): 57.5%
- Share of adults who drink (2014): 63.8%
- Share of adults who drink (peak year): 67.7%
- Peak year: 2008
6. Connecticut
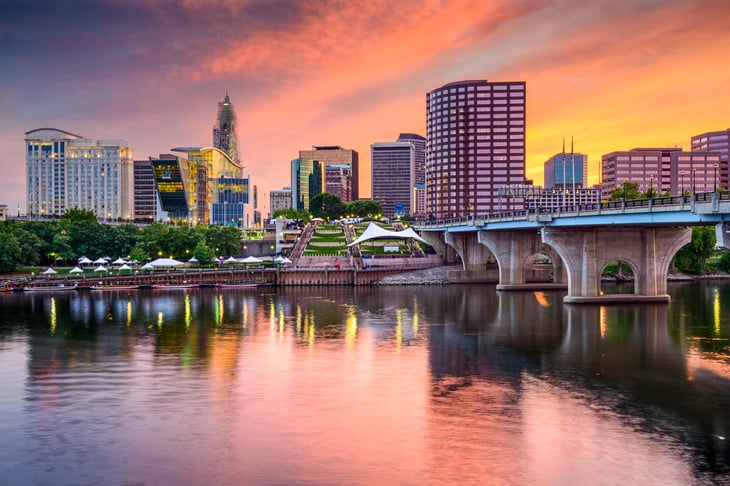
- Change from peak year: -10.2 pp
- 10-year change: -8.1 pp
- Share of adults who drink (2024): 56.7%
- Share of adults who drink (2014): 64.8%
- Share of adults who drink (peak year): 66.9%
- Peak year: 2018
5. Iowa
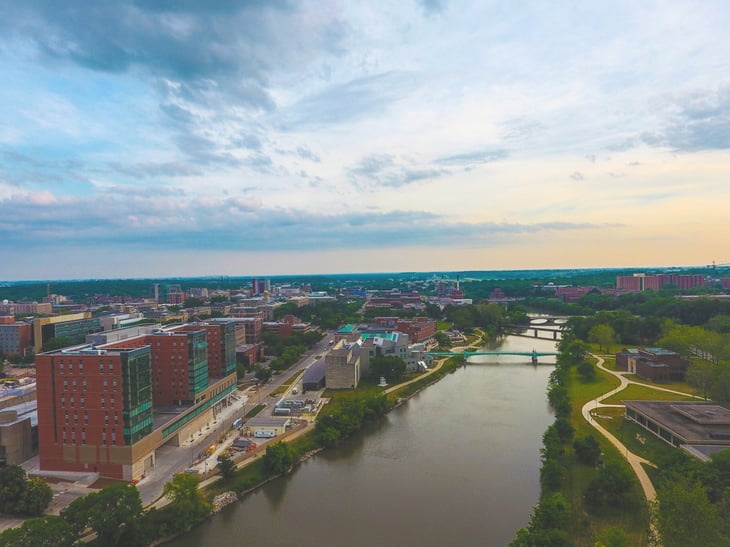
- Change from peak year: -10.3 pp
- 10-year change: -7.7 pp
- Share of adults who drink (2024): 53.2%
- Share of adults who drink (2014): 60.8%
- Share of adults who drink (peak year): 63.5%
- Peak year: 2017

4. Wisconsin

- Change from peak year: -10.6 pp
- 10-year change: -8.1 pp
- Share of adults who drink (2024): 59.5%
- Share of adults who drink (2014): 67.6%
- Share of adults who drink (peak year): 70.1%
- Peak year: 2005
3. Maryland
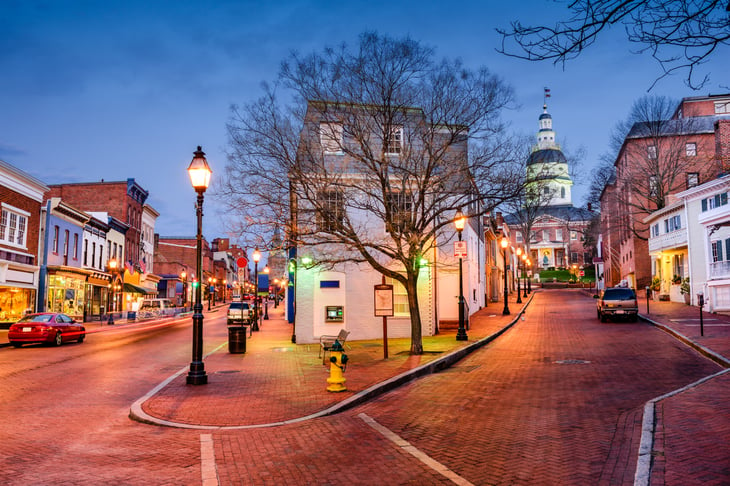
- Change from peak year: -11.1 pp
- 10-year change: -10.7 pp
- Share of adults who drink (2024): 51.9%
- Share of adults who drink (2014): 62.6%
- Share of adults who drink (peak year): 63.0%
- Peak year: 2015
2. Arizona
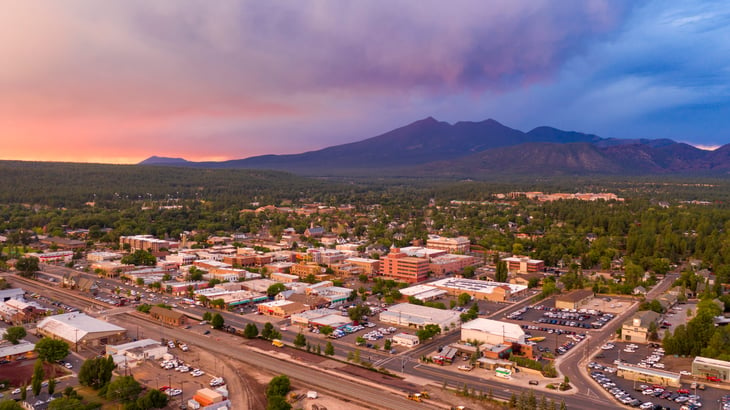
- Change from peak year: -12.8 pp
- 10-year change: -9.0 pp
- Share of adults who drink (2024): 47.2%
- Share of adults who drink (2014): 56.2%
- Share of adults who drink (peak year): 60.0%
- Peak year: 2005
1. Massachusetts
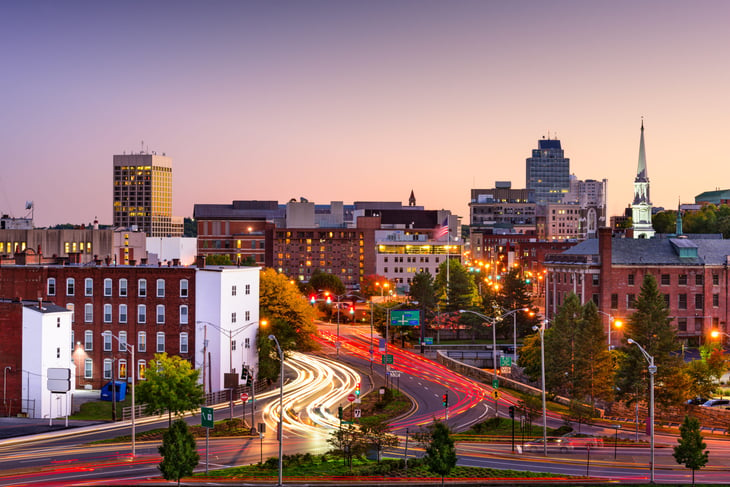
- Change from peak year: -13.3 pp
- 10-year change: -10.5 pp
- Share of adults who drink (2024): 56.1%
- Share of adults who drink (2014): 66.7%
- Share of adults who drink (peak year): 69.5%
- Peak year: 2013
Methodology

This analysis draws on data from the Substance Abuse and Mental Health Services Administration’s (SAMHSA) State Estimates on past-month alcohol use among adults aged 18 and older.
The “share of adults who drink” reflects SAMHSA’s annual estimate of the percentage of adults reporting alcohol use in the past month during the specified survey year.
For each state, the year with the highest recorded share of adults reporting alcohol use — referred to as the peak year — was identified. The percentage-point change between that year and 2024 was calculated to show the magnitude of decline from each state’s highest level.
Because peak years differ across states, a separate 10-year comparison was conducted between 2014 and 2024 to provide an apples-to-apples view of trends over the same time period for all states.
All changes were tested for statistical significance at the 90% confidence level using a z-test (threshold: z > 1.645).

Add a Comment