


Editor's Note: This story originally appeared on Filterbuy.
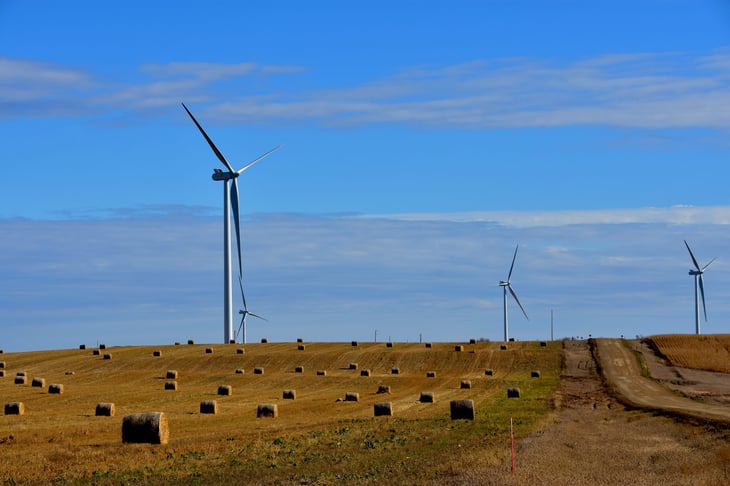
The world is now grappling with the long-term ramifications of climate change, including extreme weather events, changes to water resources and agriculture, and newfound health challenges. Many governments are mobilizing to limit the effects of climate change and reduce carbon output as quickly as they can.
And on that front, while there is much more that can be done to lower carbon emissions in the U.S., data from the last three decades shows that America has begun trending in the right direction.
The turning point came in 2007, and the economic recession may have been the reason why. When the economy began to slow in 2007, it initially meant less industrial activity and less use of transportation, which reduced carbon emissions in those sectors. The government stimulus package passed in 2009 provided a number of incentives for development and adoption of renewable technologies, so as the economy came back, cleaner fuel sources were powering the recovery. The result is that total carbon dioxide emissions are down 14.5% overall compared with 2007.
Of course, not every state is lowering its carbon dioxide emissions at the same rate. Our look at the states with the highest levels of carbon emissions on a per capita basis finds that the leading states have two factors in common: a low population density and economies dependent on production of carbon-emitting fuels extracted in that state.
To find these locations, researchers at Filterbuy used data from the U.S. Energy Information Administration and the U.S. Census Bureau to rank states on carbon emissions per capita. Our team also collected data on total carbon emissions, the fuel source and sector with the most carbon emissions, and the population density for each state.
Here are the states with the highest (and lowest) carbon emissions per person.
1. Wyoming

Annual carbon dioxide emissions per capita: 105.4 metric tons
Total annual carbon dioxide emissions: 61.0 million metric tons
Fuel source with the most carbon dioxide emissions: Coal
Sector with the most carbon emissions: Electric power
Population density: 6.0 people per square mile
2. North Dakota
Annual carbon dioxide emissions per capita: 74.9 metric tons
Total annual carbon dioxide emissions: 56.5 million metric tons
Fuel source with the most carbon dioxide emissions: Coal
Sector with the most carbon emissions: Electric power
Population density: 11.0 people per square mile
3. West Virginia

Annual carbon dioxide emissions per capita: 50.3 metric tons
Total annual carbon dioxide emissions: 91.3 million metric tons
Fuel source with the most carbon dioxide emissions: Coal
Sector with the most carbon emissions: Electric power
Population density: 74.6 people per square mile

4. Louisiana

Annual carbon dioxide emissions per capita: 48.8 metric tons
Total annual carbon dioxide emissions: 227.9 million metric tons
Fuel source with the most carbon dioxide emissions: Petroleum
Sector with the most carbon emissions: Industrial
Population density: 107.6 people per square mile
5. Alaska

Annual carbon dioxide emissions per capita: 46.3 metric tons
Total annual carbon dioxide emissions: 34.3 million metric tons
Fuel source with the most carbon dioxide emissions: Natural gas
Sector with the most carbon emissions: Industrial
Population density: 1.3 people per square mile
6. Montana

Annual carbon dioxide emissions per capita: 28.9 metric tons
Total annual carbon dioxide emissions: 30.5 million metric tons
Fuel source with the most carbon dioxide emissions: Coal
Sector with the most carbon emissions: Electric power
Population density: 7.3 people per square mile
7. Indiana

Annual carbon dioxide emissions per capita: 26.6 metric tons
Total annual carbon dioxide emissions: 177.0 million metric tons
Fuel source with the most carbon dioxide emissions: Coal
Sector with the most carbon emissions: Electric power
Population density: 187.9 people per square mile
8. Kentucky

Annual carbon dioxide emissions per capita: 25.7 metric tons
Total annual carbon dioxide emissions: 114.3 million metric tons
Fuel source with the most carbon dioxide emissions: Coal
Sector with the most carbon emissions: Electric power
Population density: 113.1 people per square mile
9. Texas

Annual carbon dioxide emissions per capita: 25.1 metric tons
Total annual carbon dioxide emissions: 711.0 million metric tons
Fuel source with the most carbon dioxide emissions: Petroleum
Sector with the most carbon emissions: Industrial
Population density: 111.0 people per square mile
10. Nebraska

Annual carbon dioxide emissions per capita: 25.0 metric tons
Total annual carbon dioxide emissions: 48.0 million metric tons
Fuel source with the most carbon dioxide emissions: Coal
Sector with the most carbon emissions: Electric power
Population density: 25.2 people per square mile
Next, the 10 states with the lowest per capita carbon emissions.
1. New York

Annual carbon dioxide emissions per capita: 8.1 metric tons
Total annual carbon dioxide emissions: 157.7 million metric tons
Fuel source with the most carbon dioxide emissions: Petroleum
Sector with the most carbon emissions: Transportation
Population density: 412.8 people per square mile
2. Maryland

Annual carbon dioxide emissions per capita: 8.6 metric tons
Total annual carbon dioxide emissions: 52.0 million metric tons
Fuel source with the most carbon dioxide emissions: Petroleum
Sector with the most carbon emissions: Transportation
Population density: 622.8 people per square mile
3. California

Annual carbon dioxide emissions per capita: 9.2 metric tons
Total annual carbon dioxide emissions: 360.9 million metric tons
Fuel source with the most carbon dioxide emissions: Petroleum
Sector with the most carbon emissions: Transportation
Population density: 253.6 people per square mile

4. Vermont

Annual carbon dioxide emissions per capita: 9.3 metric tons
Total annual carbon dioxide emissions: 5.8 million metric tons
Fuel source with the most carbon dioxide emissions: Petroleum
Sector with the most carbon emissions: Transportation
Population density: 67.7 people per square mile
5. Oregon

Annual carbon dioxide emissions per capita: 9.3 metric tons
Total annual carbon dioxide emissions: 38.6 million metric tons
Fuel source with the most carbon dioxide emissions: Petroleum
Sector with the most carbon emissions: Transportation
Population density: 43.9 people per square mile
6. Massachusetts

Annual carbon dioxide emissions per capita: 9.3 metric tons
Total annual carbon dioxide emissions: 63.7 million metric tons
Fuel source with the most carbon dioxide emissions: Petroleum
Sector with the most carbon emissions: Transportation
Population density: 883.7 people per square mile
7. Connecticut

Annual carbon dioxide emissions per capita: 9.4 metric tons
Total annual carbon dioxide emissions: 33.6 million metric tons
Fuel source with the most carbon dioxide emissions: Petroleum
Sector with the most carbon emissions: Transportation
Population density: 736.3 people per square mile
8. Rhode Island

Annual carbon dioxide emissions per capita: 9.5 metric tons
Total annual carbon dioxide emissions: 10.1 million metric tons
Fuel source with the most carbon dioxide emissions: Petroleum and natural gas
Sector with the most carbon emissions: Transportation
Population density: 1,024.5 people per square mile
9. New Hampshire

Annual carbon dioxide emissions per capita: 10.0 metric tons
Total annual carbon dioxide emissions: 13.5 million metric tons
Fuel source with the most carbon dioxide emissions: Petroleum
Sector with the most carbon emissions: Transportation
Population density: 151.9 people per square mile
10. Washington

Annual carbon dioxide emissions per capita: 10.6 metric tons
Total annual carbon dioxide emissions: 78.7 million metric tons
Fuel source with the most carbon dioxide emissions: Petroleum
Sector with the most carbon emissions: Transportation
Population density: 114.6 people per square mile
Methodology

The data used in this analysis is from the U.S. Energy Information Administration’s Energy-Related CO2 Emission Data Tables and the U.S. Census Bureau’s 2019 American Community Survey. The emissions data utilized for rankings is from the year 2017, the most recent data available.
To determine the states with the highest carbon emissions, researchers ranked states based on the annual carbon dioxide emissions per capita. In the event of a tie, the state with the greater total annual carbon dioxide emissions was ranked higher.
Annual carbon dioxide emissions per capita is displayed in “metric tons of energy-related carbon dioxide per person.” Total annual carbon dioxide emissions are displayed in “million metric tons of energy-related carbon dioxide.” Population density was calculated as the state population divided by its land area in square miles.
Add a Comment
Our Policy: We welcome relevant and respectful comments in order to foster healthy and informative discussions. All other comments may be removed. Comments with links are automatically held for moderation.