
Editor's Note: This story originally appeared on SmartAsset.com.
Given the increasing number of obstacles first-time homebuyers face, SmartAsset took a closer look at the best cities for them to purchase their first home.
Historically, first-time homebuyers have made up about 40% of all homebuyers in the U.S. However, over the past decade, the share of first-time homebuyers has fallen below that norm, hovering around in the one-third range, according to data from the National Association of Realtors. In fact, it dipped still further over the past year – falling 2 percentage points from 33% in 2019 to 31% in 2020 – with many researchers attributing the drop to tightening inventory and rising prices.
We compared 163 of the largest U.S. cities across four categories (a total of 12 metrics). This is SmartAsset’s 2021 study on the best cities for first-time homebuyers. Check out the 2020 edition here. For details on our data sources and how we put all the information together to create our final rankings, check out the Data and Methodology section at the end.
1. Nashville, TN

Nashville, Tennessee, ranks in the top 10% of cities for three of the four categories that we considered: home market favorability, affordability and employment. Its best ranking is for the employment category, with the 23rd-lowest March 2021 unemployment rate (4.5%) and the 32nd-highest five-year change in median household income (+34.42%). In the categories of home market favorability and affordability, Nashville ranks in the top 30 cities for three metrics: five-year home value appreciation (69.70%), housing costs as a percentage of income (22.24%) and average effective property tax rate (0.63%).
2. Boise, ID

Boise, Idaho, moved up in this year’s study, after ranking No. 4 last year. Boise ranks in the top fourth of cities for all four categories and additionally ranks in the top 15 for four individual metrics. The four top-ranking metrics include its five-year home value appreciation (64.50%), foreclosures per 10,000 homes (0.29), average commute time (less than 19 minutes) and March 2021 unemployment rate (3.5%). Additionally, many other young residents are choosing to settle down and buy homes or apartments in the area. The under-45 homeownership rate is 40.93%, 42nd-highest in our study.
3. Grand Rapids, MI

The home market in Grand Rapids, Michigan, is particularly favorable for individuals looking to buy. Grand Rapids has the 21st-best price-to-rent ratio (14.10) and the 40th-highest five-year home value appreciation (more than 53%). Additionally, the state of Michigan has the 18th-lowest foreclosure rate across all 50 states and the District of Columbia, at about 0.37 per 10,000 homes. Grand Rapids also ranks 24th- and 19th-best in our affordability and employment categories, respectively.
4. Omaha, NE

Across all 12 metrics we looked at, Omaha, Nebraska, ranks well for its low foreclosure rate and March 2021 unemployment rate. Nebraska has the 10th-lowest foreclosure rate, with 0.32 foreclosures for every 10,000 homes, when compared with all other states and the District of Columbia. U.S. Bureau of Labor Statistics data additionally shows that the March 2021 unemployment rate of 3.3% in the greater Douglas County was more than 5 percentage points lower than the national average. Omaha’s under-45 homeownership rate is 43.61%, the 31st-highest in our study.
5. Murfreesboro, TN

Across all 163 cities in the study, Murfreesboro, Tennessee, ranks sixth-best in our employment category and 26th-best in our affordability category. The city has the 13th-lowest March 2021 unemployment rate (4.1%) and the 22nd-highest five-year change in median household incomes (+38.25%). Murfreesboro ranks in approximately the top third of cities for three of the four metrics in our affordability category: down payment-to-income ratio (0.95), housing costs as a percentage of income (23.80%) and average effective property tax rate (0.66%).
6. Henderson, NV
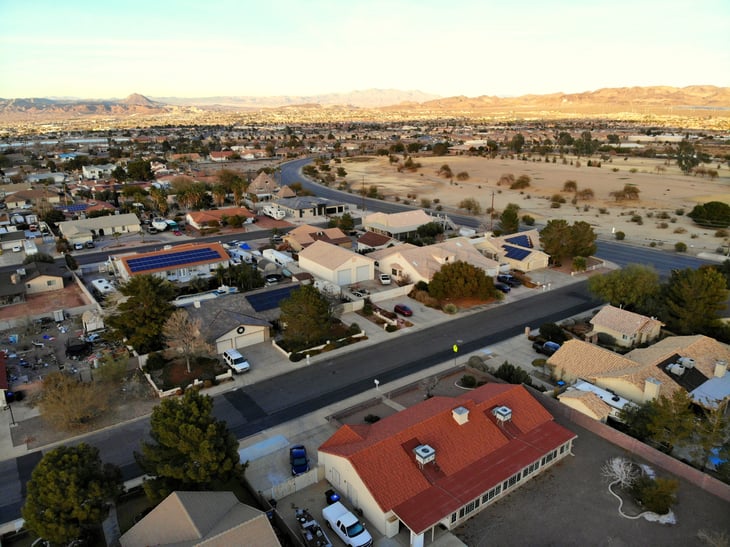
Henderson, Nevada, ranks third-best for affordability, making it an accessible city for individuals or families looking to purchase a first-time home. Median annual housing costs in the city make up only about 20% of the median household income. Additionally, the under-45 homeownership rate is the 17th-highest in our study (48.69%) and the average effective property tax rate is the 20th-lowest (0.57%). Across the other three categories, Henderson ranks 40th out of 163 for home market favorability, sixth for livability and 116th for employment.
7. Reno, NV

Reno, Nevada, ranks first overall for employment and 43rd overall for livability. Regarding job opportunities, the March 2021 unemployment rate (4.6%) is the 26th-lowest in our study. Additionally, with incomes rising by almost 47% over the past five years, individuals may be able to put more money towards their savings and a potential down payment. When it comes to livability, Reno has the 97th-highest concentration of dining and entertainment establishments (9.56%), the 88th-lowest violent crime rate (less than 600 for every 100,000 residents) and the 20th-lowest average commute time (about 21 minutes).
8. Virginia Beach, VA
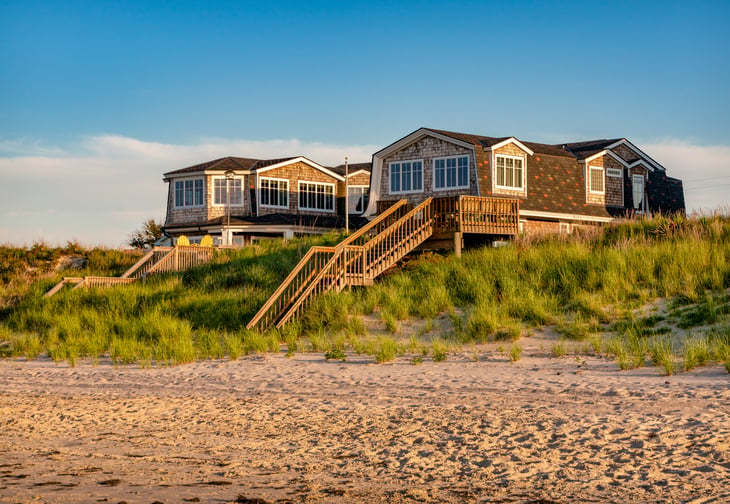
Virginia Beach, Virginia, takes the top spot when it comes to livability across all 163 cities in our study. Data from the 2019 County Business Patterns Survey, published by the U.S. Census Bureau, shows that almost 12% of establishments there are dedicated to dining and entertainment, the 24th-highest rate for this metric overall. Additionally, Virginia Beach has the 10th-lowest violent crime rate (129 per 100,000 residents) and the 56th-lowest average commute time (about 24 minutes). In terms of the other three categories, Virginia Beach ranks 80th for home market favorability, 11th for affordability and 88th for employment.
9. Sunnyvale, CA

Sunnyvale, California, ranks ninth for two categories: livability and employment. For our livability category, it has the 68th-highest concentration of dining and entertainment establishments (10.13%), the 15th-lowest violent crime rate (less than 170 per 100,000 residents) and the 51st-lowest average commute time (about 24 minutes). When it comes to employment, Sunnyvale has the 38th-lowest March 2021 unemployment rate (5.1%) and the sixth-highest five-year change in median household income (+44.70%).
10. Olathe, KS

Olathe, Kansas, rounds out our list of the top 10 cities for first-time homebuyers, ranking best for our affordability category. Olathe has the third-highest under-45 homeownership rate overall (65.10%). Additionally, the city ranks 14th for its down payment-to-income ratio (0.73) and housing costs as a percentage of income (20.79%). Olathe also ranks in the top fourth of cities for two other categories – home market favorability and employment.
Data and Methodology

To find the best cities for first-time homebuyers, we looked at data on the 200 largest U.S. cities. Complete data was available for 163 of those cities. We compared those cities across four categories:
- Home market favorability. For our home market favorability category, we looked at the price-to-rent ratio, five-year home value appreciation and foreclosure rate. Data comes from the Census Bureau’s 2019 and 2014 1-year American Community Surveys and RealtyTrac.com. Foreclosure rate is measured at the state level.
- Affordability. Our affordability category includes the under-45 homeownership rate, housing costs as a percentage of income, effective property tax rate and down payment-to-income ratio. Data for the first three metrics comes from the Census Bureau’s 2019 1-year American Community Survey. We calculated the down payment-to-income ratio using March 2021 median sale price data from Redfin along with median household income data from the Census Bureau’s 2019 1-year American Community Survey.
- Livability. For our livability category, we considered the concentration of dining and entertainment establishments, average commute time and violent crime rate. Data on establishments and commuting comes from the Census Bureau’s 2019 County Business Patterns Survey and 2019 1-year American Community Survey. Crime data comes from the FBI and is for 2019. The concentration of dining and entertainment establishments is at the county level.
- Employment. This includes the March 2021 unemployment rate and the five-year change in median household income. Data comes from the Bureau of Labor Statistics and the Census Bureau’s 2019 and 2014 1- year American Community Surveys. Unemployment data is measured at the county level.
We ranked each city in every metric and found an average ranking and score for each category. We then found a final score, averaging the four category scores. The city with the highest cumulative score ranked at the top of our list.


Add a Comment
Our Policy: We welcome relevant and respectful comments in order to foster healthy and informative discussions. All other comments may be removed. Comments with links are automatically held for moderation.