


Editor's Note: This story originally appeared on SmartAsset.com.
The COVID-19 pandemic has made road races less frequent and temporarily closed down many indoor workout facilities. Now, as restrictions ease amid the increased percentage of vaccinated Americans, many folks may be poised to reclaim their exercise routines. In light of these dynamics, SmartAsset has identified and ranked the best cities for runners.
To find the best cities for runners, we considered the following metrics: walk score, pedestrian fatality rate, gyms per 10,000 residents, number of races in 2019, percentage of the city that is parkland and income after housing costs. For details on our data sources and how we put all the information together to create our final rankings, check out the Data and Methodology section at the end.
This is the 2021 edition of our study on the best cities for runners. Read the 2020 version here.
1. New York, NY

New York City is the top city for runners. It places first in two of our metrics: walk score (89.2) and gyms per 10,000 residents (3.60). The city hosted 67 races for competitive runners in 2019, the sixth-highest in our study.
2. Washington, D.C.
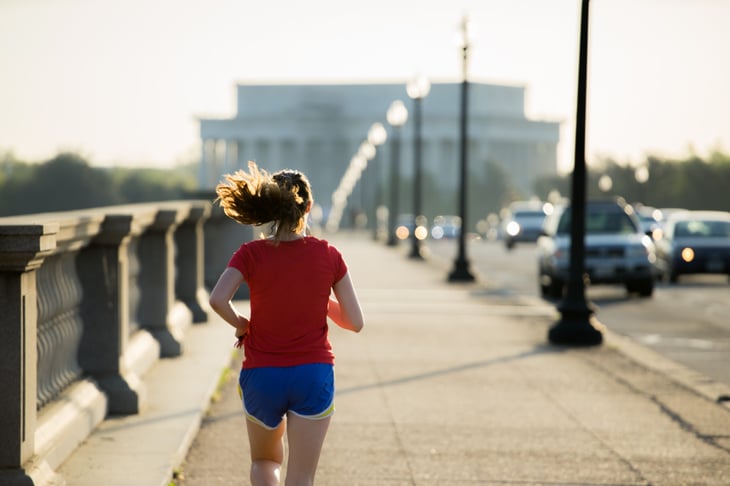
The nation’s capital ranks in the top 10 for four different metrics: seventh for gyms per 10,000 residents (52), eighth for income after housing costs ($71,290), eighth for percentage of the city that is parkland (24.33%) and ninth for walk score (77.3).
3. Seattle, WA

Seattle is the highest-ranking West Coast city on this list. The Emerald City ranks 10th for its walk score (73.1) and 11th for its number of 2019 professional races (58). Runners in the city also have the sixth-highest income after housing costs ($79,290).
4. Boston, MA

Boston has the fourth-best walk score on this list, at 80.9. Beantown also has the 15th-highest number of gyms on our list, with 1.69 gyms for every 10,000 residents.
5. San Francisco, CA (tie)

San Francisco has the third-highest walk score in the study, at 86. It ranks second for median income after housing, at $98,023. The city, however, falls to the bottom half of the study in pedestrian safety, with 2.26 pedestrian fatalities for every 100,000 residents (measured at the state level).

5. Minneapolis, MN (tie)

Minneapolis is the highest-ranking Midwestern city in this study. It has the lowest statewide pedestrian fatality rate, with 0.75 fatalities for every 100,000 residents. The city also has 1.86 gyms for every 10,000 residents. And residents have an average income of $51,285 after housing costs, ranking 35th.
7. Arlington, VA
The median income in Arlington is $94,675 after housing costs, ranking third in this study. Arlington also ranks second for gyms, with 2.41 facilities for every 10,000 residents. This Washington, D.C., suburb, however, ranks outside of the top quartile in professional races, having hosted only 33 in 2019.
8. Madison, WI
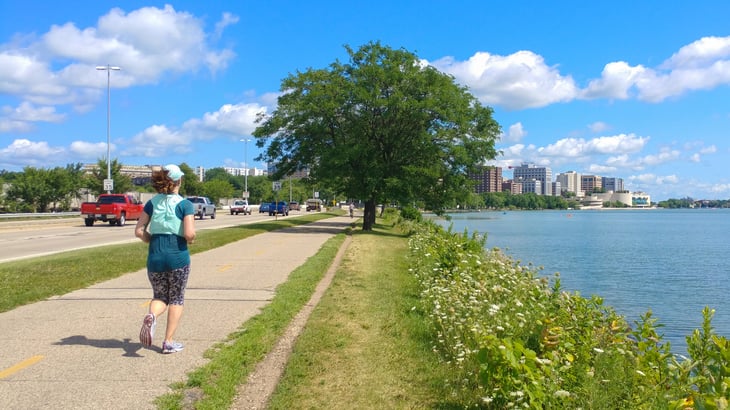
Madison, Wisconsin, ranks third in pedestrian safety, with 0.96 fatalities for every 100,000 residents in the state. This city also has 2.3 gyms for every 10,000 residents, a fourth-place ranking for this metric. Madison, however, ranks 36th for walk score, at 48.7.
9. St. Paul, MN
St. Paul, Minnesota, is the safest city for runners in this study, with 0.75 pedestrian fatalities for every 100,000 residents statewide. It also has a lot of running space, with 14.14% of the city made up of parkland, 21st place for this metric in the study. In addition, St. Paul is 41st in the study for median income after housing costs ($49,278).
10. Denver, CO

The Mile High City ranks fifth in gym density, with 2.28 workout facilities for every 10,000 residents. It’s 19th on the list for competitive races, hosting 50 in 2019. Denver, however, doesn’t have as many parks to run in, finishing in the bottom half, with only 8.43% of the city made up by parkland.
Data and Methodology

To find the best cities for runners, we analyzed data for 95 of the largest U.S. cities across the following six metrics:
- Walk score. This is a measure of a city’s overall walkability on a scale of 0 to 100, with 100 representing an extremely walkable city. Data comes from walkscore.com.
- Pedestrian fatality rate. This is the number of pedestrians killed in automobile accidents per 100,000 residents. Data comes from the National Highway Traffic Safety Administration, is for 2018 and is measured at the state level.
- Gyms per 10,000 residents. This is the number of gyms per 10,000 residents. Data comes from the U.S. Census Bureau’s 2018 County Business Patterns survey.
- Races held in 2019. Races include all 5Ks, 10Ks, half-marathons, marathons and ultra-marathons that take place in the city. Data comes from runningintheusa.com.
- Percentage of city that is parkland. This is the total adjusted city area divided by total parkland measured in acres. Data comes from the Trust for Public Land’s 2020 report.
- Income after housing costs. The median total income for residents after accounting for housing costs. Data comes from the Census Bureau’s 1-year American Community Survey for 2019.
First, we ranked each city in each metric, giving every metric equal weight. Then we found each city’s average ranking. Using this average ranking, we created our final score. The city with the highest average ranking received a 100. The city with the lowest average ranking received a 0.
Add a Comment
Our Policy: We welcome relevant and respectful comments in order to foster healthy and informative discussions. All other comments may be removed. Comments with links are automatically held for moderation.