


This story originally appeared on Filterbuy.
Today, the split of urban and rural Americans looks almost inverted compared with the population distribution of more than two centuries ago. In 2010, the share of Americans living in urban areas surpassed 80 percent for the first time. With increasingly divergent economic prospects in urban and rural America, there is good reason to believe that the trend toward city living could continue. While many rural areas stagnate or decline, urban areas continue to attract jobs and capital investment.
One question now, however, is whether COVID-19 will slow down or reverse that pattern. The hustle and bustle that gives large, densely-populated cities their character — with large numbers of people from many different places constantly crossing paths and crowding together — also creates the conditions for widespread transmission of viruses like COVID-19. Indeed, some of the worst-hit areas in the pandemic have been dense urban centers, including America’s two largest metros: New York City and Los Angeles.
As a result, there are some early indications that urbanites are showing a greater preference for low-density living with more outdoor space. But as the fall surge of coronavirus cases in the upper Midwest has shown, even rural communities are not invulnerable from viral spread, and it remains to be seen whether these shifts in living preferences will prove durable even after vaccines are widely available and the threat of COVID-19 subsides.
For now, urbanization remains the dominant characteristic in many parts of the country outside of New England, the Midwest, and parts of the South. In fact, nine states have more than 90 percent of their population living in urban areas, led by California at 95 percent. Across the country, only four states — Mississippi, West Virginia, Vermont, and Maine — have less than half of their population in urban areas.
To find which cities have the highest and lowest population density, researchers at Filterbuy collected population and land area figures for every U.S. city with a population above 100,000 to calculate the population density per square mile. The researchers also pulled population data from 2010 to show how density has changed in these cities over the last decade.
Here are the most densely populated cities in America, followed by the least densely populated.
New York, NY

- Population density (per square mile): 27,747.9
- Change in population density since 2010: 1.87%
- 2019 population: 8,336,817
- 2010 population: 8,184,899
- 2019 land area (square miles): 300.4
San Francisco, CA

- Population density (per square mile): 18,790.8
- Change in population density since 2010: 9.46%
- 2019 population: 881,549
- 2010 population: 805,463
- 2019 land area (square miles): 46.9
Boston, MA

- Population density (per square mile): 14,362.6
- Change in population density since 2010: 11.74%
- 2019 population: 694,295
- 2010 population: 621,383
- 2019 land area (square miles): 48.3

Miami, FL

- Population density (per square mile): 13,000.5
- Change in population density since 2010: 16.68%
- 2019 population: 467,968
- 2010 population: 400,892
- 2019 land area (square miles): 36.0
Chicago, IL

- Population density (per square mile): 11,846.5
- Change in population density since 2010: -0.21%
- 2019 population: 2,693,959
- 2010 population: 2,698,831
- 2019 land area (square miles): 227.4
Philadelphia, PA

- Population density (per square mile): 11,796.8
- Change in population density since 2010: 3.66%
- 2019 population: 1,584,064
- 2010 population: 1,528,306
- 2019 land area (square miles): 134.3
Washington, D.C.

- Population density (per square mile): 11,545.9
- Change in population density since 2010: 16.76%
- 2019 population: 705,749
- 2010 population: 604,453
- 2019 land area (square miles): 61.1
Long Beach, CA
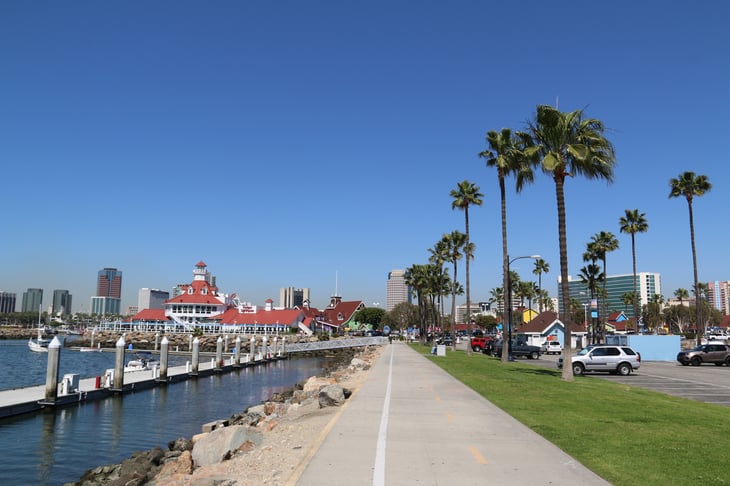
- Population density (per square mile): 9,122.7
- Change in population density since 2010: -0.30%
- 2019 population: 462,645
- 2010 population: 462,793
- 2019 land area (square miles): 50.7
Seattle, WA
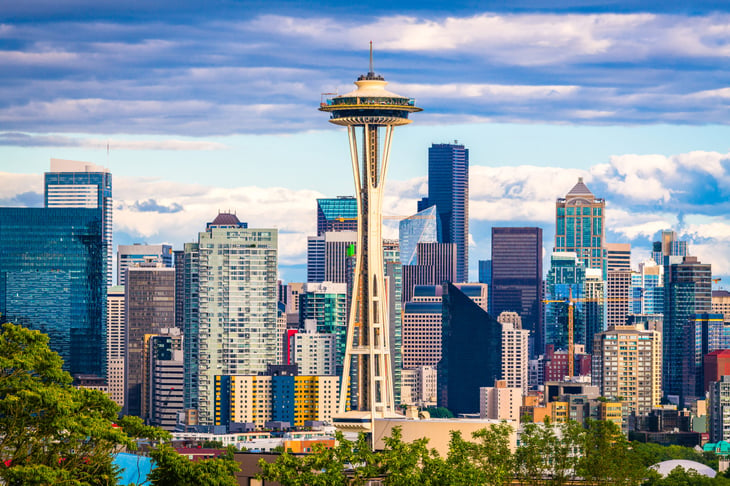
- Population density (per square mile): 8,973.0
- Change in population density since 2010: 23.41%
- 2019 population: 753,655
- 2010 population: 610,710
- 2019 land area (square miles): 84.0
Los Angeles, CA
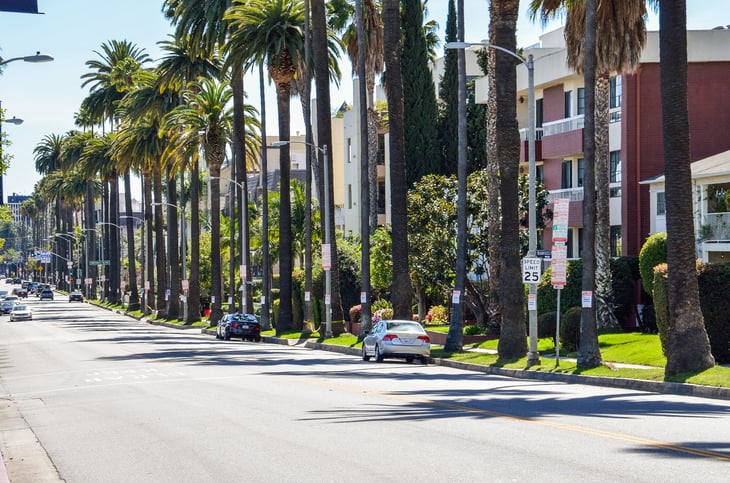
- Population density (per square mile): 8,476.4
- Change in population density since 2010: 4.80%
- 2019 population: 3,979,537
- 2010 population: 3,797,144
- 2019 land area (square miles): 469.5
Next, the least densely populated cities.
Oklahoma City, OK

- Population density (per square mile): 1,080.3
- Change in population density since 2010: 12.53%
- 2019 population: 655,158
- 2010 population: 582,278
- 2019 land area (square miles): 606.5
Jacksonville, FL

- Population density (per square mile): 1,219.8
- Change in population density since 2010: 10.75%
- 2019 population: 911,528
- 2010 population: 823,316
- 2019 land area (square miles): 747.3
Nashville, TN

- Population density (per square mile): 1,405.9
- Change in population density since 2010: 10.77%
- 2019 population: 668,580
- 2010 population: 602,618
- 2019 land area (square miles): 475.6
Kansas City, MO

- Population density (per square mile): 1,574.0
- Change in population density since 2010: 7.54%
- 2019 population: 495,278
- 2010 population: 460,665
- 2019 land area (square miles): 314.7
Virginia Beach, VA

- Population density (per square mile): 1,838.7
- Change in population density since 2010: 2.45%
- 2019 population: 449,974
- 2010 population: 439,172
- 2019 land area (square miles): 244.7

Tulsa, OK

- Population density (per square mile): 2,034.4
- Change in population density since 2010: 1.67%
- 2019 population: 401,760
- 2010 population: 393,577
- 2019 land area (square miles): 197.5
Memphis, TN

- Population density (per square mile): 2,192.4
- Change in population density since 2010: 6.50%
- 2019 population: 651,088
- 2010 population: 647,870
- 2019 land area (square miles): 297.0
Tucson, AZ
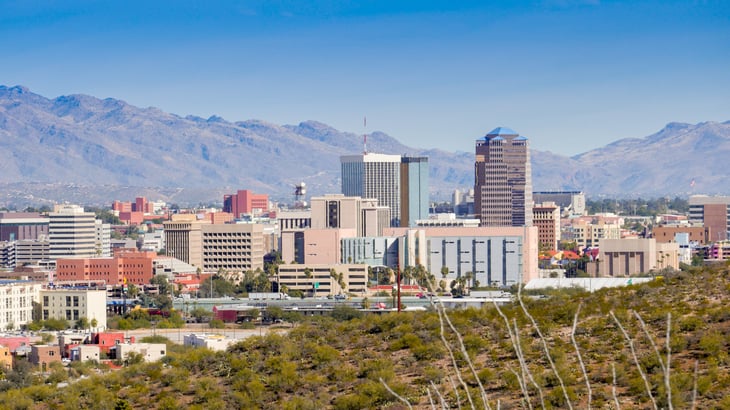
- Population density (per square mile): 2,274.3
- Change in population density since 2010: 5.17%
- 2019 population: 548,082
- 2010 population: 521,132
- 2019 land area (square miles): 241.0
New Orleans, LA
- Population density (per square mile): 2,301.9
- Change in population density since 2010: 12.16%
- 2019 population: 390,144
- 2010 population: 347,858
- 2019 land area (square miles): 169.5
Aurora, CO

- Population density (per square mile): 2,369.8
- Change in population density since 2010: 11.72%
- 2019 population: 379,312
- 2010 population: 326,719
- 2019 land area (square miles): 160.1
Methodology & Detailed Findings

Population statistics are from the U.S. Census Bureau American Community Survey 1-Year Estimates. Land areas for each city are from the U.S. Census Bureau’s TIGERweb data.
To identify the most and least densely populated locations, researchers divided the total 2019 population by the 2019 land area in square miles. Researchers also calculated the percentage change in population density comparing 2019 population and land area to 2010 population and land area. In most cases, changes in population density were the result of changes in population between the two time periods; however, the land area of certain locations also changed significantly since 2010.
Only cities with at least 100,000 people in 2019 were included in the analysis.
Add a Comment
Our Policy: We welcome relevant and respectful comments in order to foster healthy and informative discussions. All other comments may be removed. Comments with links are automatically held for moderation.